Introduction
In this blog post I would like show you step-by-step how to build a report in PowerPivot with DAX expressions. For my current customer I have to build a report that calculates the daily sales and a comparison with a budget. I've gathered the following requirements:- Calculate monthly sales to determine how much of this product has been sold per company, day and month.
- Extrapolate monthly sales (estimation) and compare this with the budget.
The following restrictions are relevant here:
- The working days must be taken into consideration.
- Holidays must be taken in consideration.
- The targets are monthly based.
This blog post is based on the paragraph entitled "Working days" from the book "The definitive guide to DAX" by Marco Russo and Alberto Ferrari.
The datamodel
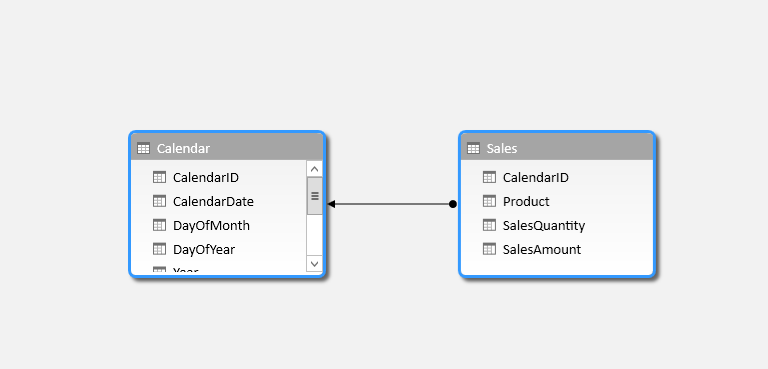
A proper data model is designed with a sales fact table and a calendar dimension table. Rob Collie refers to these as data lookup tables and data tables, but I prefer dimension and fact tables.
Calendar dimension
For designing and filling the calendar dimension I would like to use a previous blogpost of mine in which I discuss building a calendar dimension in Excel. For this blogpost, I haveextended this example with the following fields:
- DayInWeek : = WEEKDAY(B2)
- WorkingDay : = IF(OR(WEEKDAY(B2)=1, WEEKDAY(B2)= 7), "N", "Y")
- Holiday : Manually entered values Y for a holiday like Easter and N if not.
- MonthNumber : = MONTH(1&LEFT(G10,3))
Below is a snippet of the calendar dimension where I included the holidays Easter and King's day (in the Netherlands).

This example was created with Excel but you can also generate this in SQL Server with a stored procedure for instance. This I would normally prefer.
Sales sample data
For example, I have created some sales data in the workbook. I have gathered some data for two months - March and May - because there are some holidays in these months and therefore it's possible to test the holiday scenario.

In this example, there are products sold on weekends and weekdays.
The PowerPivot data model
The next step is building the PowerPivot datamodel. This can do done by using CTRL-T of the table in Excel. Then give the table a name and add this to the data model.
Don't forget to mark the calendar table as a date table in order to use time intelligence functions.
Building the measures
Normally, the next step would be to build the explicit measure layer in PowerPivot. In this layer the data source and the rest of the DAX expressions are separated from each other. But, for the sake of this example, I will not do that. I have created the following DAX Measures:
NumOfDays:=COUNTROWS(Calendar)

NumOfWorkingDays:=CALCULATE([NumOfDays], Calendar[WorkingDay] = "Y")

NumOfWorkingDaysIncHolidays:=CALCULATE([NumOfWorkingDays], Calendar[Holiday] = "N")

SalesAmount:=SUMX(Sales, Sales[SalesQuantity] * Sales[Unitprice])

DailySales:=DIVIDE([SalesAmount], [NumOfDays])

WorkDailySales:=DIVIDE([SalesAmount], [NumOfWorkingDays])

HoliWorkDailySales:=DIVIDE([SalesAmount], [NumOfWorkingDaysIncHolidays])
These measures make a distinction between days, workingdays and holidays.
Let's take a look at the pivot table. For sorting the months I added an extra column in the calendar dimension MonthNumber (=MONTH(1&LEFT(G10,3))) and G10 is the Month name. Nice trick.

For instance, April has 30 days, of which 22 are workingdays. However, when the holidays are subtracted we can see that there are really only 20 days for labor.
Now, let's take a look at the SalesAmount in the pivot table:

I have set the settings of the PivotTable to show the rows even when there is no data for a month. Now you can see that the Grand Total of Daily Sales is much lower than the average for April and May. If we divide 416.68 (the total annual sales) by 365 days we get 1.14, but that is not right. Thus it's better to divide it by something else. We have to neglect the days there was no data in the sales table.
NumOfDays:=IF([SalesAmount] > 0, COUNTROWS(Calendar))
But nothing happens. It only clears the values if you have a larger calendar dimension than I have. Marco Russo and Alberto Ferrari call this a "granularity mismatch" in their book "The Definitive Guide to DAX". The numbers are accurate at the month level but inaccurate at the Grand Total level. The problem is how to determine the right granularity level. This is a business rule and it depends on how you build the pivot table in your report.
We have to use an iterator: SUMX and SUMX iterates over the values and sums them by a certain level of granularity. In my case I would like to use a monthly granularity.
DailySales:=DIVIDE([SalesAmount], SUMX(VALUES(Calendar[MonthName]), [NumOfDays]))

WorkDailySales:=DIVIDE([SalesAmount], SUMX(VALUES(Calendar[MonthName]),[NumOfWorkingDays]))

HoliWorkDailySales:=
DIVIDE([SalesAmount], SUMX(VALUES(Calendar[MonthName]),[NumOfWorkingDaysIncHolidays]))
And this results in the following pivottable:

And I manually calculated the Grand Total of the Sales measures and the numbers are correct.
So where are we now?
In the beginning of this blog post I listed gathered some requirements. Let's see what we have done so far:Monthly sales. How much have we sold of this product or per company.- Extrapolate of monthly sales and compare this to the target.
Take the working days in consideration.Take the holidays in consideration.- The targets are monthly based.
Estimated Sales
For this reason, I have entered some extra data to the Sales table until 'today'.
Furthermore, I have added an extra column to the Calendar dimension, WorkingDayInMonth and this is a running number in the Calendar dimension that is raised by 1 of the day is a working day and not a holiday. Below is an example from the month December for which I have added some test data for the WorkingDayInMonth column.

By doing so, I can lookup the current working day that depends on the current day of the month. For instance, it's now December 14th and the current working day is 11. It is now possible to calculate the sales amount that is earned by the company and then calculate the extrapolated sales amount for the working days left in the current month.
I have added some extra measures to the Power Pivot workbook.
Today:=DATE(YEAR(NOW()),MONTH(NOW()),DAY(NOW()))

WorkingToday:=LOOKUPVALUE(Calendar[WorkingDayInMonth], Calendar[CalendarDate], Calendar[Today])

SalesEstimation:=IF(MONTH(NOW()) = MAX(Calendar[MonthNumber]),
 DIVIDE(([SalesAmount] * [NumOfWorkingDaysIncHolidays]), [CurrentWorkingToday]),[SalesAmount])
The measure 'Today' is used by the other measure 'WorkingToday' for looking up in the Calendar dimension. The WorkingToday is the current working day in the current month. Perhaps you would like to limit this measure by the current month scope, but I will leave that up to you.
The measure SalesForecast calculates the estimated sales in the current month by using the following pseudo-formula:
EstimatedSales = SUM(SalesAmount/WorkingDaysSofar x NumOfWorkingDaysIncHolidays)
And this is the result of the calculation (I renamed SalesForecast to SalesEstimation):

At this point there is only one problem and that is the SalesEstimation on the Grand Total level.
In order to avoid confusion, I added an extra IF to the measure :
SalesEstimation:=
IF(COUNTROWS(VALUES(Calendar[MonthNumber])) = 1,
  IF(MONTH(NOW()) = MAX(Calendar[MonthNumber]),
 DIVIDE(([SalesAmount] * [NumOfWorkingDaysIncHolidays]), [CurrentWorkingToday]),[SalesAmount]),
 BLANK()
)
Resulting in

Conclusion
This blog post describes an implementation of a Daily Sales Report for a month with an estimation of sales amount in the current month.Greetz
Hennie


