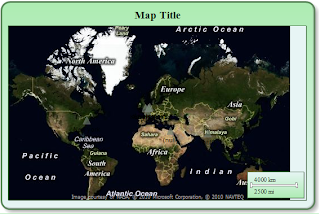
In the first two parts (part 1 and part 2) i explained the geocoding process and now let's plot the spatial information on a map with SQL Server 2008 R2 Report Builder 3.0. This article is bases on a article of siddharth Mehta from the SQLserverperfomance site. You can download Report Builder 3.0 from here. Report Builder 3.0 introduces additional visualizations including maps, sparklines and databars which can help produce new insights well beyond what can be achieved with standard tables and charts.
1. Ok this is the starting point. I added some columns but you won't need it for this exercise.
2. Open Report Builder, create a new blank report and a new datasource. Something like this:
3. Create a dataset:
4. Startup the map wizard:
5. Select SQL Server spatial query
6. Choose spatial data and map view options:
7.. Choose color theme and data visualization
5. And this is the result.
So, this is geocoding....
Greetz,
Hennie


Geen opmerkingen:
Een reactie posten