dinsdag 17 augustus 2010

Plotting spatial data on a map (Part III)

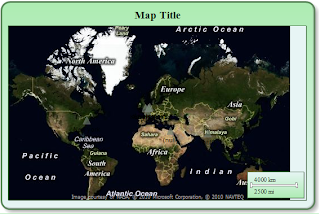
In the first two parts (part 1 and part 2) i explained the geocoding process and now let's plot the spatial information on a map with SQL Server 2008 R2 Report Builder 3.0. This article is bases on a article of siddharth Mehta from the SQLserverperfomance site. You can download Report Builder 3.0 from here. Report Builder 3.0 introduces additional visualizations including maps, sparklines and databars which can help produce new insights well beyond what can be achieved with standard tables and charts.

1. Ok this is the starting point. I added some columns but you won't need it for this exercise.


2. Open Report Builder, create a new blank report and a new datasource. Something like this:


3.  Create a dataset:


4. Startup the map wizard:


5. Select SQL Server spatial query


6. Choose spatial data and map view options:


7.. Choose color theme and data visualization


5. And this is the result.


So, this is geocoding....

Greetz,
Hennie

vrijdag 13 augustus 2010

Inmon vs Kimball according to....Inmon himself

What the... a couple of weeks ago Inmon produced an article on his blog. A smile appearred on my face. Inmon talking about the comparison between Kimball and Inmon. Interresting. Let's see what he has to say. He starts a bit grumpy and i had a deja vu remembering him presenting at the BI event where i already had the impression that he was a bit grumpy. But ok....Let's see what he has to say...

So first he explains the two different systems, first Kimball and then Inmon. In the part about Kimball he explains that Kimball "in order to resolve differences of granularity between fact tables, conformed dimensions are used.". Hmm i never thought about that, in that manner. In my view conformed dimensions are used for getting an integrated view between fact tables and so you can use the conformed dimensions for 'hopping' between business processes and combine the measures from this different facts. So this way you can consolidate your datawarehouse. It's not quite clear what he meant by this statement. What are we trying to resolve with conformed dimensions, concerning granularity? When building an integrated view of facts with different granularities still needs some additional logic. When one fact is connected to one dimensionrecord, another fact record can connect to two dimension records. From my viewpoint, conformed dimensions are not a solution for resolving granularities between facts. They can aid building integrated views, like dashboards, etc.

Inmon explains some stuff about his metholodogy, which i agree most of it. The only point i want to make is that Datavault by Linstedt is DW2.0 proof and could be a better alternative than the relational approach of Inmon, but that's my opinion.

Okay, the bulletpoints (of Inmon):
  • The long-term or short-term nature of the solution. If what you want is speed of development and good short term results, Kimball is the way to go. If you want a long-term architectural solution, then the Inmon approach is the way to go (Comment: Agree)
  • If you want a tactical solution, then Kimball is the way to go. If you want a strategic solution, then Inmon is the way to go (Comment: Agree)
  • The Kimball approach is very fragile. Whenever requirements undergo significant change, the Kimball solution is “brittle.” (Comment: Agree).
  • In the Kimball approach, there is no single version of the truth, no system of record. In the Inmon approach, at the integrated granular level, there is a carefully crafted single version of the truth (Comment: Interresting. In the projects 've done building kimball datawarehouses we always try to build a clean ETL and what i mean by this, at first i let the garbage in the data and showed the data quality in the cubes (building a cube is easy when you have a star created already). After that i started to squeze the bad data by building error marts. So there is not really a base where the data is collected in a consolidated system. So, he is right about this).
  • The Kimball approach produces results in a short amount of time. The Inmon approach produces results over a longer period of time.(Comment: Yup, Kimball is quickstarter for enterprise datawarehouses but Inmon will take the lead later in the project. on the other hand for implementing a Inmon like datawarehouse it's more likely to have more support from the higher management. With Kimball it's easier to implement the 'Think big, start small' approach)
  • The Kimball architecture does not produce a foundation that can be built on over time as requirements change (Comment: agree with that)
  • The Kimball architecture focuses on a narrow set of infrastructure components such as tables and indexes. The Inmon architecture is far more robust than the Kimball architecture including such things as unstructured, textual data, near line storage, archival storage and processing the tight integration of metadata into the infrastructure (Comment: Kimball approach can be built upon unstructured data, but he hasn't or doesn't want to incorporate that in his methodology. This is a less important argument)
So, what can we learn about this? So, here's my advice:
  1. Choose Inmon when the information needs are not quite clear, when the information request are varied, when information requests are very ad hoc, the 'system of record' principle is important, when the datawarehouse is very strategic to a organisation or when there is time to build a consolidation layer.
  2. Choose Kimball when you built a datawarehouse as a silod system, when the information requests won't change that very much, when the datawarehouse is not very strategic but more tactical (departmental) or when you want to show quick results.
Greetz!
 
Hennie

woensdag 11 augustus 2010

Web Service Task : "The selected Web method contains unsupported arguments"

Hi,

In a former post of mine i used a script task in SSIS for connecting to a webservice. When hovering the toolbox in SSIS i noticed a Web Service Task and i thought: "Why not try this for connecting to the Bing webservice for getting the geocode information". Okay...well that isn't that simple.  So i started to set up a HTTP connection manager. Something like this:


The next thing is to setup the Web Service Task:


Hey, what's that ? : "The selected Web method contains unsupported arguments.". Searching the internet, it appears to me that the Web Service Task is very.... very limited as i read on several blogs:
As Simon Sabin complains, there is no documentation about the unsupported features. I think that the Web Service Task is built on a certain WSDL version and newer versions are not supported (still in 2008 R2!).

I've seen some examples that do work:
So i've read a couple of posts of people who did find a solution by adjusting the WSDL file, by dropping or commenting out some elements that are beyond SSIS capabilities:
  • Deleting complextypes from WSDL File.
  • There's an issue with GUID
May be the best advice is: DON'T USE THE WEBSERVICE TASK AND USE THE SCRIPT TASK!
The book "Professional Microsoft SQL Server 2008 Integrations Services" tells me that the web service task is not a common source for large volumes of data and this is why Microsoft doesn't pay a lot of attention to this feature, off course.

Gr,
Hennie

donderdag 5 augustus 2010

What is data?

I follow now and then some discussions about data. Some say: “well data is like water; it flows through your organization and people will use the data as they like”. It’s a nice analogy but it’s too simple to say that, because data can be of all kinds of forms: simple, complex, float, text, etc. So data is flowing through your organization as little, big, roundy or roughly pieces. Little pieces for the easy businessprocesses and complex data for complex analytical questions. So, data can have all kind of forms and characteristics. Let’s describe some more characteristics of data:

• Data is a representation of the world around us, at some moment in time. Some data will be accurate (temperature readings) and some won’t (human entry systems). So, especially, don’t expect that data is non - erroneous representation of the world around us. It will allways has flaws. This is what we call data quality. How accurate describes data the world around us?

• Data has a life cycle. Data is created, updated, expired, renewed, destroyed, backupped, etc. In a datawarehouse we  mostly keep all the data for years in a detailed level. Why? Well, because we can, we never know if we gonna need it, we don’t know how we are gone use it (lowest grain), because diskspace is cheap, etc etc. All reasons to keep the data in your systems.

Data about fashion sales in a fashionshop of the last day can be very important. Fashion sales from a couple of months ago about a certain day will be less important. May be data should aggregate more when it's get older. Below you can see a couple of data life cycle curves positioned against importance.


• Data can be very valuable at a moment in time. This depends on the success of the actions of an organization, department or person. Data is only valuable when it’s used. If it’s not used it doesn’t represent a value.

• Data can be aggregated to a higher level or it could be kept at a low level (grain).

• Data describes something and it can describe things : master data and it can describe events: transactional data.

• Data will be less valuable when the source is difficult to determine or unclear. Also when the data is ‘scrambled’ during ETL processes users tend to discuss this and could feel unsecure whether the data is correct.

• Data could be objective or it could be subjective. Objective when it’s trivial, like the address of a customer but it will be less objective when the data is processed for business decisions. Mostly data quality is mentioned with operational data like an address of a customer but when the data is aggregated to a higher level the ‘data quality’ of this indicator is also important. In this case the business rules should be judged for correction adaptation.

Gr,
Hennie

dinsdag 3 augustus 2010

Geography (Part II)

In the first article about spatial information, we have seen an example of transforming some textual based location information into a longitude and latitude with a webservice. But even this information is not ready for using in a map. Therefore we need to convert the longitude and latitude into some sort of geometrical points.

SQL Server 2008 introduced the geometrical datatype, which gives some more flexibility and a better use for maps. As stated in an article on developerfusion, there is also another type Geometry. The SQL Server team has concluded that this type based on open standards wasn’t adequate for some scenarios. In the artivle Siddharth Mehta he introduced a script task in SSIS in which he updates the geocoded data with an UPDATE statement. I decided not to use this and decided to code this in T-SQL.

First i had to decode the , in . because i had my regional settings set on Dutch and the POINT expects . as an inputparameter. After that i used the static function geography::STPointFromText.

This gives the following results:


SSMS sees that we are working with a spatial column in our result set and displays an new tab : Spatial results:


At first i didn't see anything, after that i thought that i saw some dirt on the screen but when i hovered over the points a tooltip showed up.

Ok, next time we're gone built a report with report builder 3.0 and convert this information into some visual information.

So that's it for now!

Greetz,
Hennie

zondag 1 augustus 2010

System-of-record-only implementation

This is the third article in the series about MDM based on the article “Master Data Management from a technical perspective” from Microsoft (april 2010). As I mentioned in the first post, i have noticed that there are 4 implementation possibilities of Master Data management:

 
Master data registry implementation
Data aggregation implementation.
• System-of-record-only implementation.
• Complete enterprise master data management implementation.

 
This blog is about the 'System-of-record-only implementation’. In this implementation there are more systems of entry's in contrast with the data aggregation implementation. The data is transported bidirectional to the system of entry systems. This is solution which i had in mind when i started studying MDM. Data is entered in any systems and it's compared with MDM system.


These implementations still require a degree of data integration and ongoing cleansing as elements may come from both the source system and the master data management application. Also, many times this system of entry only has the ability to detect data issues directly related to the initial use. For instance, any customer information that is not stored in the CRM solution will not be available to determine complete data quality.
 
Advantages:
  • MDM can run in the background
  • Less impact for users.


Disadvantages
  • Complexity.
  • On going cleansing.


Greetz,
Hennie