donderdag 23 juni 2011

SSAS/Kimball : building a multivalue dimension construction in SSAS (part II)

In my former post i'll already explained the background for this post. If you didn't read this than i would advice reading this first post before reading this article. In this article i'll explain about building a multivalue dimension in SSAS (MM dimension). This post covers the following subjects:

  • Prerequisites.
  • Building a cube.

    Prerequisites
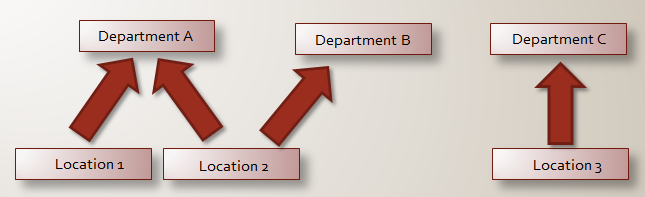
    Below you can see a script i've been using for building a cube. At the end of the script i've added a couple of facts/events.  So when we will quering this cube the following results should be shown for departments:
    • Department A : 3
    • Department B : 2
    • Department C : 2

    And for the locations:
    • Location 1 : 1
    • Location 2 : 2
    • Location 3 : 2

    First create a database and execute the following script:

    IF  EXISTS (SELECT * FROM sys.objects WHERE object_id = OBJECT_ID(N'[dbo].[TestFact]') AND type in (N'U'))
    DROP TABLE [dbo].[TestFact]
    GO

    CREATE TABLE [dbo].[TestFact](
        [TestFactID] [int] IDENTITY(1,1) NOT NULL,
        [FK_Date_Key] [int] NOT NULL,
        [FK_Location_Key] [int] NOT NULL,
        [TestFactCount] [int] NOT NULL
    ) ON [PRIMARY]
    GO

    ----
    IF  EXISTS (SELECT * FROM sys.objects WHERE object_id = OBJECT_ID(N'[dbo].[Location]') AND type in (N'U'))
    DROP TABLE [dbo].[Location]
    GO

    CREATE TABLE [dbo].[Location](
        [Location_Dim_key] [int] NOT NULL,
        [Location_Code] [int] NOT NULL,
        [Location_Description] [varchar](50) NOT NULL
    ) ON [PRIMARY]
    GO

    ----
    IF  EXISTS (SELECT * FROM sys.objects WHERE object_id = OBJECT_ID(N'[dbo].[Department]') AND type in (N'U'))
    DROP TABLE [dbo].[Department]
    GO

    CREATE TABLE [dbo].[Department](
        [Department_Dim_key] [int] NOT NULL,
        [Department_Code] [int] NOT NULL,
        [Department_Description] [varchar](50) NOT NULL
    ) ON [PRIMARY]
    GO

    ---
    IF  EXISTS (SELECT * FROM sys.objects WHERE object_id = OBJECT_ID(N'[dbo].[Bridge_Location_Department]') AND type in (N'U'))
    DROP TABLE [dbo].[Bridge_Location_Department]
    GO

    CREATE TABLE [dbo].[Bridge_Location_Department](

        [Bridge_Location_Department_ID] [int] IDENTITY(1,1) NOT NULL,
        [FK_Location_Key] [int] NOT NULL,
        [FK_Department_Key] [int] NOT NULL,
        [Valid_From] [date] NOT NULL,
        [Valid_Until] [date] NOT NULL
    ) ON [PRIMARY]
    GO

    ---
    IF EXISTS (SELECT * FROM sys.objects WHERE object_id = OBJECT_ID(N'[dbo].[DimDate]') AND type in (N'U'))
    DROP TABLE [dbo].[DimDate]
    GO

    CREATE TABLE [dbo].[DimDate](
    [Date_dim_key] [int] NULL,
    [Date_Year] [int] NULL
    ) ON [PRIMARY]
    GO

    ---

    INSERT INTO dbo.Department (Department_Dim_key, Department_Code, Department_Description)
    VALUES (1, 1, ' Department A' ),(2, 2, ' Department B' ), (3, 3, ' Department C')

    INSERT INTO dbo.Location (Location_Dim_key, Location_Code, Location_Description)
    VALUES (1, 1, ' Location 1' ),(2, 2, ' Location 2' ), (3, 3, ' Location 3')

    INSERT INTO dbo.Bridge_Location_Department (FK_Location_Key, FK_Department_Key, Valid_From, Valid_Until)
    VALUES (1, 1, '2011-01-01', '9999-12-31' ),
    (2, 1, '2005-01-01', '9999-12-31' ),
    (2, 2, '2005-01-01', '9999-12-31' ),
    (3, 3, '2005-01-01', '9999-12-31' )

    INSERT INTO dbo.DimDate
    VALUES (1,2000),
    (2, 2001),
    (3, 2002),
    (4, 2003),
    (5, 2004),
    (6, 2005),
    (7, 2006),
    (8, 2007),
    (9, 2008),
    (10, 2009),
    (11, 2010),
    (12, 2011),
    (13, 2012),
    (14, 2013),
    (15, 2014),
    (16, 2015)


    INSERT INTO [MultiValueDimension].[dbo].[TestFact]
               ([FK_Date_Key]
               ,[FK_Location_Key]
               ,[TestFactCount])
    VALUES
               (7, 1, 1),
               (7, 2, 1),
               (8, 3, 1),
               (9, 3, 1),
               (9, 2, 1)


    Building a cube
    Okay, now we have to build a cube based on the tables created in SQL Server. Kimball calls this a multivalue dimension (actually it's a variant on the multivaluedimension, in my opinion). Microsoft calls this a many-to-many dimension (MM). Marc Russo published a great whitepaper on this subject. Many-to-many dimension (MM) is a better name for this subject. What can we say about Many-to Many dimension construction in relation to the case we are building:
    • There are two measure groups needed.
    • There are two dimnsions needed.
    • The bridge Location Department table will be Intermediate Measure Group. The intermediate Measure Group is the measure group that relates the MM dimension to the regular dimension In this case it relates the location to the department dimension.
    • Location is the intermediate dimension.


    Designing this in the cube designer shows this picture:


    So how does this looks in the dimension usage tab of the cube designer?


    As said earlier in the post: location and department are the dimensions. Testfact and the bridge location department table are the measure groups. So when we check the results in the browser we see the following results for the locations:


    And for the departments:


    The total is still 5 but adding the departments subtotals manually is equal to 7!!!

    And this is as predicted at the beginning of this post. So we have reached nirvana. Well not quite yet. What about history?  What if a location do not exist anymore between departments and locations? What if locations shift from locations to other departments? You want to count your facts at right departments in a correct timeline! I'll blog about this in the future.

    So, this is it for now.

    Greetz,
    Hennie

    vrijdag 17 juni 2011

    SSRS : Setting up a A4 page in Reporting Services

    Hi,

    I'm always a bit rusty when i start building reports in Reporting Services after a while. One thing i always has to figure out is how to set up the page size, body and margins. In a article on Microsoft you can find more information about this subjct. You can set the properties in the properties window or you can set the properties with report properties window (Menu -> Report -> Report properties). The relation between page, body, header and footer looks conceptual like the diagam below.


    Below you can see how i manually set the page size of the report with A4 paper settings.


    And don't forget to set the body properties:


    The formula of setting the PageSize Width, bodysize and margins is this: Page Width = Body Width+ Left margin + Right Margin. In my case 21= 19+1+1.

    In case of the height of the report you need to set the pagesize. In case of A4 : 29,7cm. In case of the body height you can set whatever you wan't. By setting the PageSize Height property the height of A4 is maintained and when the body height is larger than the pageSize (minus top margin and bottom margin) more pages are displayed/printed.

    It's also possible to set the properties with the report properties window. Below you can see an example in inches.


    We end up with the follow values for the proprties:


    Greetz,

    Hennie

    dinsdag 14 juni 2011

    SSAS/KIMBALL: modeling a N:M relation between dimensions (part I)

    Hi,

    During the development of a dashboard for a customer i've a awkward problem. The situation is like this: There are events in the every daily business (fact) and these events can happen on certain locations (physical) locations. These locations can be shared by different (logical) departments.  So conceptually you have something like this:


    And if you model this in a Bachman diagram (3NF) it will look like this:


    So there are two standard entities and one associative entity has been added for handling the n:m relation. This way n:m relations can be easily modeled in 3NF. So the values for the department table will be :
    1. Department A
    2. Department B
    3. Department C
    The values for the location table are:

    1. Location 1
    2. Location 2
    3. Location 3
    And the associative table "Department_Location" contains :

    1. 1 (Department A), 1 (Location 1)
    2. 1 (Department A), 2 (Location 2)
    3. 2 (Department B), 2 (Location 2)
    4. 3 (Department C), 3 (Location 3)
    And you could introduce a valid_from and a valid_to (as in temporal modeling) where you can check the validity whenever the record is valid or not. Relations exists and can no longer exist at some point in time.

    A first assumption of me was modeling the location and the department seperately (the grain of the fact is at location level):


    So the grain is at Location level and therefore a 'simple' dimension is enough. But the fact can happen at different departments (e.g. in case of location 1) and therefore i introduced a bridge table. So the key of the fact table is pushed to the bridge department table and the department dimension key is also pushed to the bidge department table. But wait a minute.....there is a drawback of this modeling solution. You can't see whether which location belongs to which department, unless a fact has happen. If a fact didn't happen you can't determine whether a location belongs to a department. So i needed a better solution than this.

    The solution
    So studying kimball's book : "the datawarehouse lifecycle toolkit, second edition" shows me a example on page 270, paragraph "many-values dimensions with bridge tables". In this example a account dimension and Customer dimension is used with a bridge table. A weighting factor can help adding facts to the right customer. But i'm my situation i don't know how the facts are related to the department. Sometimes 99% of the facts belongs to the departments and sometimes less facts and this is not sure.  So in my case a proper modeling solution is this :


    In this case it's possible to determine which location belongs to which department.

    Kimball recommends adding a valid_from and a valid_to column to the bridge table (as i already explained in the 3NF example) because a relation can exist at a certain point in time and they can no longer exist at some moment.

    Next time i'll explain how to build this in SSAS.

    Greetz,
    Hennie

    zondag 12 juni 2011

    SSAS: NON EMPTY and INNER/LEFT OUTER JOINing

    Today a post about joining in SQL, the NON EMPTY operator and the nonempty() function in MDX. The origin of this blog started when a customer asked why some months on a graph didn't show up. So i started looking at the NON EMPTY operator and the NonEmpty() function.

    Prerequisites
    At first i tried to create a representative query on AdventureWorks cube. When i finally succeeded i tried to buid a query in SQL and at first glance building the simple MDX query to SQL seems easy but i gave up on this and i decided to built my own lab environment. This confirmed my believe that MDX is a very powerful query language. Hard to understand but when you have mastered it you can create powerful reports. Here is the SQL script is used for this small experiment.

    1. Execute this script in SSMS:

    USE [NonEmpty]
    GO

    IF EXISTS (SELECT * FROM sys.objects WHERE object_id = OBJECT_ID(N'[dbo].[DimDate]') AND type in (N'U'))
    DROP TABLE [dbo].[DimDate]
    GO

    CREATE TABLE [dbo].[DimDate](
    [Date_dim_key] [int] NULL,
    [Date_Year] [int] NULL
    ) ON [PRIMARY]
    GO

    --TRUNCATE TABLE dbo.DimDate
    --GO

    INSERT INTO dbo.DimDate
    VALUES (1,2000),
    (2, 2001),
    (3, 2002),
    (4, 2003),
    (5, 2004),
    (6, 2005),
    (7, 2006),
    (8, 2007),
    (9, 2008),
    (10, 2009),
    (11, 2010),
    (12, 2011),
    (13, 2012),
    (14, 2013),
    (15, 2014),
    (16, 2015)

    ------------------------------------------------------------------
    USE [NonEmpty]
    GO

    IF EXISTS (SELECT * FROM sys.objects WHERE object_id = OBJECT_ID(N'[dbo].[TestFact]') AND type in (N'U'))
    DROP TABLE [dbo].[TestFact]
    GO

    CREATE TABLE [dbo].[TestFact](
    [TestFact_ID] [int] identity (1,1) NOT NULL,
    [FK_Date_ID] [int] NULL,
    [TestFact_Count] [int] NULL
    ) ON [PRIMARY]
    GO

    INSERT INTO dbo.[TestFact]
    VALUES (1,1),
    (2, 1),
    (3, 1),
    (4, 1),
    (5, 1),
    (6, 1),
    (7, 1),
    (8, 1),
    (9, 1),
    (10, 1),
    --(11, 1),
    (12, 1),
    (13, 1),
    (14, 1),
    (15, 1),
    (16, 1)


    2. Build a simple cube on these tables:


    Experimenting with the SQL queries
    So when the customer was talking about the not showing some months on the x-axis of the graph i immediately realized it had something to do with LEFT and INNER joining problem (but in MDX).

    So here are some SQL joining queries:

    SELECT *
    FROM dbo.TestFact F
    INNER JOIN dbo.DimDate D ON F.FK_Date_ID = D.Date_dim_key


    SELECT *
    FROM dbo.DimDate D
    LEFT OUTER JOIN dbo.TestFact F ON F.FK_Date_ID = D.Date_dim_key


    BUT i'm building reports on cubes and therefore i can't use SQL queries and therefore i need MDX queries that can handle LEFT joining.

    MDX queries
    In MDX you have two options (as far is i know) for simulating INNER JOIN/LEFT/RIGHT FULL OUTER JOIN and that is the NON EMPTY keyword and the Nonempty() function. I'll show them both. First the simulation of the INNER JOIN in MDX:

    1) INNER JOIN with the NON EMPTY keyword:

    SELECT NON EMPTY {[DimDate].[DateYear].[DateYear]} ON ROWS,
    NON EMPTY {[Measures].[TestFactCount]} ON COLUMNS
    FROM [TestFact];


    2) INNER JOIN with the NONEMPTY() function:


    SELECT NONEMPTY({[DimDate].[DateYear].[DateYear]}) ON ROWS,
    NONEMPTY([Measures].[TestFactCount]} ON COLUMNS
    FROM [TestFact];


    3) LEFT OUTER JOIN with the NON EMPTY keyword

    SELECT [DimDate].[DateYear].[DateYear] ON ROWS,
    NON EMPTY{[Measures].[TestFactCount]} ON COLUMNS
    FROM [TestFact];


    4) LEFT OUTER JOIN with the NONEMPTY() function

    SELECT [DimDate].[DateYear].[DateYear] ON ROWS,
    NONEMPTY({[Measures].[TestFactCount]}) ON COLUMNS
    FROM [TestFact]


    Conclusion:
    INNER/LEFT/RIGHT OUTER/FULL OUTER joining can be simulated in MDX with the NON EMPTY keyword and/or the NonEmpty Function.

    Greetz,
    Hennie

    donderdag 2 juni 2011

    SQL Server Query best practices

    This post is one in a series of posts about SQL Server best practices. I've posted best practices about the following subjects, so far:
    This post is about "query" best practices:
    • I always write my SQL statements (SELECT, WHERE, etc) in upper case and fields and tables in according to the way they're created.
    • Write comments when something is not clear. This will aid other developers understanding your code.
    • Always write case consistent code. This will enhance transitions from Case Insensitive (CI) server/database to Case Sensitive (CS) server/database.
    • Don't use columnnumbers in ORDER BY. This will enhance readability.
    • Use ANSI joining (INNER, LEFT OUTER, RIGHT OUTER) in stead of old school joining  (*=, =*,=).
    • Don't use SELECT * in queries. Always use columnnames in SELECT statements. This will improve Disk I/O and performance. Another advantage is that when you execute a SELECT INTO it is more error prone because when a column is added it doesn't effect the insert.
    • Don't use a % at start of a LIKE expression. This result in a index scan and the index is not fully used.
    • Use proper size for variables in queries. This will lower the change of SQL injection and will improve performance
    • Use WHERE whenever possible. This reduces the dataset.
    • Don't use the trick of TOP 100 PERCENT and ORDER BY in a view. This trick is not applicable in 2005 and 2008 (and further). e.g. . CREATE VIEW xxx AS SELECT TOP (100) PERCENT ....
      (...)
      ORDER BY SortCol;
    • Don't use NOLOCK hint. This is very important because it can cause datainconsistency like dirty reads, phantom reads and lost updates.
    • Use as many "derived tables" as you can. These are faster. For example:
      SELECT FROM
      (
      SELECT 
      FROM 
      ) AS A
    • Limit the usage of scalar functions in SELECT statements. Never use a scalar function in a SELECT when a lot of rows are queried. Scalar functions acts as cursor when a lot of rowd are retrieved. Change the function into an inline view.
    • Use as less possible HINTS. HINTS prohibits the SQL engine using the automated optimization. At first it could be a performence improvement but when data grows it could be slower
    • Use as less possible negative operators like <>, NOT IN and NOT EXISTS.
    Greetz,
    Hennie