Posts tonen met het label Selfservice BI. Alle posts tonen

dinsdag 7 juni 2016

DAX : Some DAX QTD, YTD and LY calculations with a Period Dimension

Introduction

Sometimes, there are workbooks where you don't have a granularity on a daily basis available but on a higher level. For, instance on a weekly or a monthly level. The problem is that the normal time intelligence function only works on a date dimension on a day granularity) and not a higher level of granularity. In this blog post I'll write down some of the time intelligence based on a monthly basis period dimension. The key of this dimension is based on the format YYYYMM.

Netrevenue

First thing is always create an implicit summary of the measure, in this case the Net revenue. This is a best practice and has many advantages like disconnecting the busnesslogic from the business layer. For more best practices I'll advise you to take a look at this blogpost.

       
SumNR:=SUM(FactSalesPerMonth[NetRevenue])


QuarterToDate (QTD)

One requirement that is often heard is that customers want a QuarterToDate functionality. So in case of month January, February and March the values do add up and it is reset when April starts.

       
SumNetRevenueQTD:=CALCULATE ([SumNR];
                     FILTER(ALL(DimPeriodMonth);
                       DimPeriodMonth[CalendarYear] = VALUES(DimPeriodMonth[CalendarYear]) &&
                       DimPeriodMonth[Quarter] = VALUES(DimPeriodMonth[Quarter]) &&
                       DimPeriodMonth[MonthNumber] <= MAX(DimPeriodMonth[MonthNumber])
                     )
                )
 

YearToDate (YTD)

Yet another one is the YearToDate calculation. This calculation is used to summarize the numbers in a year until a certain point in time.

       
SumNRYTD:=CALCULATE ([SumNR];
                    FILTER(ALL(DimPeriodMonth);
                      DimPeriodMonth[CalendarYear] = VALUES(DimPeriodMonth[CalendarYear]) &&
                      DimPeriodMonth[MonthNumber] <= MAX(DimPeriodMonth[MonthNumber])
                    )
                  )
    

Last Year (LY)

sometimes, customers wants to compare the numbers with last year. This can be done with the following expression:

       
SumNRLY:=CALCULATE([SumNR];
                    FILTER(ALL(DimPeriodMonth);
                      DimPeriodMonth[MonthNumber] = MAX(DimPeriodMonth[MonthNumber]) &&
                      DimPeriodMonth[CalendarYear] = MAX(DimPeriodMonth[CalendarYear]) - 1
                    )
                 )       
 

QuarterToDate LastYear 

The following DAX expression can be used to calculate the Quarter To date, not for this year, but for the year before the this year. And 'this year' depends of the context of the calculation, off course.

       
SumNRQTDLY:=CALCULATE ([SumNR];
               FILTER(ALL(DimPeriodMonth);
                   DimPeriodMonth[CalendarYear] = VALUES(DimPeriodMonth[CalendarYear]) - 1 &&
                   DimPeriodMonth[Quarter] = VALUES(DimPeriodMonth[Quarter]) &&
                   DimPeriodMonth[MonthNumber] <= MAX(DimPeriodMonth[MonthNumber])
               )
            )
       

YearToDate LastYear 

And the last one I would like to mention is the Year To date but for the last year. This DAX expression calculates the sum of last year until a certain point in time (depending on the context of the calculation)

       
SumNRYTDLY:=CALCULATE ([SumNR];
               FILTER(ALL(DimPeriodMonth);
                  DimPeriodMonth[CalendarYear] = VALUES(DimPeriodMonth[CalendarYear])-1 &&
                  DimPeriodMonth[MonthNumber] <= MAX(DimPeriodMonth[MonthNumber])
               )
            )


Conclusion

This are some handy DAX expression that you can use in your calculations.

Greetz,
Hennie

donderdag 2 juni 2016

PowerPivot : Showing the latest data

Introduction

Show me the latest information that you have! This is a common requirement when you are building reports for users. Users do not always want to click on the selections or slicers (in case of a Excel workbook) in order to select the last day or last month. Just show the latest information.

For this blogpost, I've used an example for my data warehouse monitoring system, and this data warehouse monitoring systems monitors the SSIS packages that were executed. I have structured the SSIS packages into 3 levels: Environment, System and Package. For instance Sales is the environment, Staging and Mart are the systems and the SSIS ETL packages are at Package level. Now in order to know whether the data is correctly loaded for the different areas, the monitoring happens at Environment level.

The DAX Expressions

First create an expression that determines the latest loading date of your data warehouse.

       
MaxDate:=CALCULATE(MAX(Environment[EnvironmentRunTime]);ALL(Environment))


For instance this will give you this : MaxDate: 20160601

Now, add a calculated column (not measure) to the table. This will be used as the filter for the table.

       
=IF(Environment[EnvironmentRunTime] = [MaxDate]; "Latest"; "")


In order to prevent using a filter (dropdown, ugly) in Excel, you can use the filter in the CALCULATE Expression.

       
FilterMaxDuration:=CALCULATE([SumDuration]; Environment[ISLatest] = "Latest")
FilterMaxRecordsNew:=CALCULATE([SumRecordsNew]; Environment[ISLatest] = "Latest")


And now it's possible to use these measures in a Pivottable in a Excel workbook :


Conclusion

Showing the latest information is a nice trick that you can use in your PowerPivot Dashboards.

Greetz,
Hennie

zondag 14 februari 2016

DAX : Building a monthly salesreport with estimation in PowerPivot (Part III)

Introduction

This is the third blog post about the Daily Sales dashboard that I'm currently building in PowerPivot and in PowerView (Excel 2013). I am continuing to learn more and more about DAX expressions. Everytime I go a step further in the development of the PowerPivot workbooks. I see new opportunities and using better DAX expressions. This blogpost describes an evolution in the development of a daily sales report rather than a subsequent blogposts of other blogposts I have written about this subject, so far:

The case

The purpose of the workbook is analyzing the daily sales in a month. I want to see the sales in the current month but also in the previous month. I have the following requirements :
  • Report the sales in the current month in days.
  • Report the sales of the previous month in days.
  • Report the net revenue of the month so far (Month to Date).
  • The projected net revenue for the rest of the month based on the Month to Date.
  • The projected net revenue in a month (based on the MTD) vs the Same Month last Year.
  • One tab for the sales per day.
  • One tab for the sales per Brand (a collection of products).

There are some considerations that makes it interesting:
  • Products sold in the current month or previous month may not have been sold in the same month previous year.
  • Products that have been sold in the past may not sell in the current month or sold in the previous month.
  • Weekends and holidays should be excluded from the calculations. For example, if the day is a holiday it is not a working day (this is has impact on the projected sales).


There are some limitations:
  • The clients are 32bits machines. Therefore we can't store all the data in the PowerPivots because of memory limitations. For this reason I've created a view for the current month, previous month, same month last year and the previous month. So I've included 4 periods in my data to limit the amount of the data.

The Data

For this blogpost, I have created some test data for the 4 periods that I want to simulate. I have created three tables, two dimensions and one facttable.

Calendar

For this blogpost, I have created an Excel spreadsheet that contains the most relevant data. To make life easier I included an extra column WorkingDay that is a walking number that doesn't add up when it's a weekend or a holiday. 


Product

The Product dimension is a simple product table with Productdescriptions and brandnames.


Sales

The FactSales table is the fact table with the references to the dimensions and the measures in this case SalesQTY and UnitPrice.


The datamodel

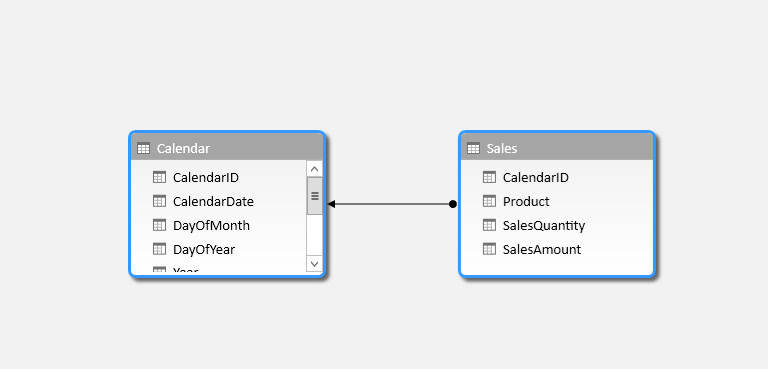
In this mock up there are three tables in the PowerPivot workbook: DimProduct, DimCalendar and FactSales. The data model is as follows:


Month Selector

The next step is introducing a month selector in the workbook. As I've mentioned in my previous blogpost, the monthselector selects the current month and a previous month based on the actual data in the Fact table.

=IF(
 DimCalendar[MonthNumber] = MONTH(LASTDATE(ALL(FactSales[CalendarDate]))) && 
 DimCalendar[Year] = YEAR(LASTDATE(ALL(FactSales[CalendarDate]))), 
 "Current Month",
 IF(
    DimCalendar[MonthNumber] = MONTH(EDATE(LASTDATE(ALL(FactSales[CalendarDate])), -1)) && 
    DimCalendar[Year] = YEAR(EDATE(LASTDATE(ALL(FactSales[CalendarDate])),-1)), 
    "Previous Month"
 )

As you may see in the screenshot, the monthselector not only selects current month and previous month but also the other months (that I've included for same month last Year calculation) I want to exclude this from my selection.


The logic I have used in my month selector should also be included in the SumNetRevenue DAX Expression. To remove an error message I've also added the MAX() function in the DAX expression.

SalesAmount:=IF(OR(
 MAX(DimCalendar[MonthNumber]) = MONTH(LASTDATE(ALL(FactSales[CalendarDate]))) &&  
 MAX(DimCalendar[Year]) = YEAR(LASTDATE(ALL(FactSales[CalendarDate]))), 
 MAX(DimCalendar[MonthNumber]) = MONTH(EDATE(LASTDATE(ALL(FactSales[CalendarDate])), -1)) &&  MAX(DimCalendar[Year]) = YEAR(EDATE(LASTDATE(ALL(FactSales[CalendarDate])),-1))
                  ), 
                SUMX(FactSales, FactSales[SalesQuantity] * FactSales[Unitprice])
              )

MTDNetrevenue

The next step is adding a Month To Date Net Revenue measure for the revenue in the current month and in the previous month.

       
MTDNetRevenue:=CALCULATE([SalesAmount], DATESMTD(DimCalendar[CalendarDate]))
 

This results in the following pivot:


As you may see in this pivot is that the MTD continue until the end of month and that is not really desirable. Therefore we need to adjust the DAX expression a bit.

MTDNetRevenue:=IF(ISBLANK([SalesAmount]), 
                  BLANK(), 
                  CALCULATE([SalesAmount], DATESMTD(DimCalendar[CalendarDate]))
                 )

And now the empty cells for net revenue are gone.


Let's see what happens for the previous month.


Projected Net Revenue

The next step is to calculate the projected net revenue for the current month. This is a calculation of an estimation of the sales based on the current MTD netrevenue or the rest of the month. This way it's possible to determine whether the sales are on track on or not. The calculation for the projected netrevenue is:

MTDNetrevenue * SumOfworkingDaysPerMonth/CurrentWorkdayoftheMonth

Let's build this in a DAX Expression:

ProjNetrevenue:=DIVIDE([MTDNetRevenue] * [SumOfWorkingDaysPerMonth], 
                        MAX(DimCalendar[WorkingDayInMonth]))

SumOfWorkingDaysPerMonth:=CALCULATE([NumOfWorkingDaysIncHolidays],
                              ALL(DimCalendar[CalendarDate]), 
                              ALL(DimCalendar[DayOfMonth]))

This is for the current month:


And the screenshot below is for the previous month. You can compare the estimation and the actual values and validate the predictions.


Let's check a value and see if the calculation is right. We take the values of 19/1/2016. This is the twelfth working day in the month and the total number of working days in the month is 20.

 ProjectedNetrevenue = 161.5*20/12 = 269,17

And this is correct.

Now we want to compare this with the complete month but in the previous year for the current month and the previous month. Now, I've written the following DAX Expression to solve this:

SMPYNetRevenue:=IF(ISBLANK([SalesAmount]), 
          BLANK(),
          CALCULATE([NetRevenue], 
          FILTER(ALL(DimCalendar), DimCalendar[Year] = MAX(DimCalendar[Year]) -1), 
          FILTER(ALL(DimCalendar), DimCalendar[MonthNumber] = MAX(DimCalendar[MonthNumber]) )
                   )
          )

Or use an improved version (with PARALLELPERIOD):

SMPYNetRevenue:=IF(ISBLANK([SalesAmount]), 
                   BLANK(),
                   CALCULATE([NetRevenue], 
                       PARALLELPERIOD(DimCalendar[CalendarDate], -12, month) 
                            )
                   )

This results in the following pivot (for the current month)


And this is for the previous month


Now we can calculate the %projectedvsSMPYNetrevenue

%ProjectedvsSMPYNetRevenue:=DIVIDE([ProjNetrevenue] - [SMPYNetRevenue], [SMPYNetRevenue])

And this results in the following pivots (for the current month):


For the previous month:


NetRevenue by Brand

In the former paragraphs we discussed the net revenue split by day. In this paragraph we add an extra tab to the worksheet and build a Daily sales report for the brands (Dimproduct). For this reason I have adjusted the Same Month Previous Year Net Revenue calculation a bit (SMPYNetRevenue)

SMPYNetRevenue:=
 IF(ISBLANK([SalesAmount]), 
    BLANK(),
    CALCULATE([NetRevenue], 
       ALLEXCEPT(DimCalendar, DimCalendar[CalendarDate], DimCalendar[Monthselector]),
       FILTER(ALL(DimCalendar), DimCalendar[Year] = MAX(DimCalendar[Year]) -1), 
       FILTER(ALL(DimCalendar), DimCalendar[MonthNumber] = MAX(DimCalendar[MonthNumber]) )
     )
)

Or use the version with PARALLELPERIOD :

SMPYNetRevenue:=
 IF(ISBLANK([SalesAmount]), 
    BLANK(),
    CALCULATE([NetRevenue], 
       ALLEXCEPT(DimCalendar, DimCalendar[CalendarDate], DimCalendar[Monthselector]),
       PARALLELPERIOD(DimCalendar[CalendarDate], -12, month) 
     )
)

And in the screenshot below the Same month Previous Year calculation .


Projected net revenue

Yet another challenge is that the projected Net Revenue depends on the selection of the Calendardate slicer. If a date is selected, the projected net revenue is calculated based on the current working day. If the analysis is done in the pivot on a daily basis (row context) then it's no problem because the projected net revenue expression can calculate the projected net revenue of the month with the rowcontext. In case of the net revenue per brand there is not a date selected. You have to select a date and the projectednetrevenue is properly calculated. For this reason I adjusted the projected net revenue DAX expression to :

ProjNetrevenue:=DIVIDE([MTDNetRevenue] * [SumOfWorkingDaysPerMonth],
                 IF(ISFILTERED(DimCalendar[CalendarDate]),       
                    MAX(DimCalendar[WorkingDayInMonth]),   
                    [CurrentWorkingDay] 
                   )                
                )

Remove the (blank) from the slicer

The last problem I would like to discuss is the (blank) in the Slicer of the monthselector. Because I need the data of the periods for the calculations it's not possible to remove this, but I don't want the (blank) in the selector because it confuses users. 


Too bad, there seems no real solution for this. The solution that I read from the PowerPivotPro forum was the following:
  1. It's only possible for vertical slicers (set it to vertical).
  2. Reorder the slicer with the Descending.
  3. Select "Show item with no data last"
  4. Adjust the window such that you can only see Current and previous month

And this is the result:


Not really happy with this solution but it seems that there is no better solution. Suggestions are welcome.

Conclusion

DAX is interesting for analyzing and building dashboards and great reports in Excel PowerBI (v1 en Desktop). Sometimes I lack the possibility to do more customization of the components in Excel.

Greetz,

Hennie


dinsdag 15 december 2015

DAX : Building a monthly salesreport with estimation in PowerPivot (Part I)

Introduction 

In this blog post I would like show you step-by-step how to build a report in PowerPivot with DAX expressions. For my current customer I have to build a report that calculates the daily sales and a comparison with a budget. I've gathered the following requirements:
  • Calculate monthly sales to determine how much of this product has been sold per company, day and month.
  • Extrapolate monthly sales (estimation) and compare this with the budget.

The following restrictions are relevant here:
  • The working days must be taken into consideration.
  • Holidays must be taken in consideration.
  • The targets are monthly based.

This blog post is based on the paragraph entitled "Working days" from the book "The definitive guide to DAX" by Marco Russo and Alberto Ferrari.

The datamodel

A proper data model is designed with a sales fact table and a calendar dimension table. Rob Collie refers to these as data lookup tables and  data tables, but I prefer dimension and fact tables.

Calendar dimension 

For designing and filling the calendar dimension I would like to use a previous blogpost of mine in which I discuss building a calendar dimension in Excel. For this blogpost, I haveextended this example with the following fields:
  • DayInWeek : = WEEKDAY(B2)
  • WorkingDay : = IF(OR(WEEKDAY(B2)=1, WEEKDAY(B2)= 7), "N", "Y")
  • Holiday : Manually entered values Y for a holiday like Easter and N if not.
  • MonthNumber : = MONTH(1&LEFT(G10,3))

Below is a snippet of the calendar dimension where I included the holidays Easter and King's day (in the Netherlands).


This example was created with Excel but you can also generate this in SQL Server with a stored procedure for instance. This I would normally prefer.

Sales sample data

For example, I have created some sales data in the workbook. I have gathered some data for two months - March and May - because there are some holidays in these months and therefore it's possible to test the holiday scenario.


In this example, there are products sold on weekends and weekdays.

The PowerPivot data model

The next step is building the PowerPivot datamodel. This can do done by using CTRL-T of the table in Excel. Then give the table a name and add this to the data model. 


Don't forget to mark the calendar table as a date table in order to use time intelligence functions.


Building the measures

Normally, the next step would be to build the explicit measure layer in PowerPivot. In this layer the data source and the rest of the DAX expressions are separated from each other. But, for the sake of this example, I will not do that. I have created the following DAX Measures:

NumOfDays:=COUNTROWS(Calendar)

NumOfWorkingDays:=CALCULATE([NumOfDays], Calendar[WorkingDay] = "Y")

NumOfWorkingDaysIncHolidays:=CALCULATE([NumOfWorkingDays], Calendar[Holiday] = "N")

SalesAmount:=SUMX(Sales, Sales[SalesQuantity] * Sales[Unitprice])

DailySales:=DIVIDE([SalesAmount], [NumOfDays])

WorkDailySales:=DIVIDE([SalesAmount], [NumOfWorkingDays])

HoliWorkDailySales:=DIVIDE([SalesAmount], [NumOfWorkingDaysIncHolidays])    
 

These measures make a distinction between days, workingdays and holidays.

Let's take a look at the pivot table. For sorting the months I added an extra column in the calendar dimension MonthNumber (=MONTH(1&LEFT(G10,3))) and G10 is the Month name. Nice trick.


For instance, April has 30 days, of  which  22 are workingdays. However, when the holidays are subtracted we can see that there are really only 20 days for labor.

Now, let's take a look at the SalesAmount in the pivot table:


I have set the settings of the PivotTable to show the rows even when there is no data for a month. Now you can see that the Grand Total of Daily Sales is much lower than the average for April and May. If we divide 416.68 (the total annual sales) by 365 days we get 1.14, but that is not right. Thus it's better to divide it by something else. We have to neglect the days there was no data in the sales table.

       
NumOfDays:=IF([SalesAmount] > 0, COUNTROWS(Calendar))
 

But nothing happens. It only clears the values if you have a larger calendar dimension than I have. Marco Russo and Alberto Ferrari call this a "granularity mismatch" in their book "The Definitive Guide to DAX". The numbers are accurate at the month level but inaccurate at the Grand Total level. The problem is how to determine the right granularity level. This is a business rule and it depends on how you build the pivot table in your report.

We have to use an iterator: SUMX and SUMX iterates over the values and sums them by a certain level of granularity. In my case I would like to use a monthly granularity.

DailySales:=DIVIDE([SalesAmount], SUMX(VALUES(Calendar[MonthName]), [NumOfDays]))

WorkDailySales:=DIVIDE([SalesAmount], SUMX(VALUES(Calendar[MonthName]),[NumOfWorkingDays]))

HoliWorkDailySales:=
DIVIDE([SalesAmount], SUMX(VALUES(Calendar[MonthName]),[NumOfWorkingDaysIncHolidays])) 
 

And this results in the following pivottable:


And I manually calculated the Grand Total of the Sales measures and the numbers are correct.


So where are we now?

In the beginning of this blog post I listed gathered some requirements. Let's see what we have done so far:
  • Monthly sales. How much have we sold of this product or per company.
  • Extrapolate of monthly sales and compare this to the target.
  • Take the working days in consideration.
  • Take the holidays in consideration.
  • The targets are monthly based.
In the next section I would like to give some thoughts on extrapolation of the current month sales, This way we can determine whether the monthly sales targets and actual sales are on target.

Estimated Sales

For this reason, I have entered some extra data to the Sales table until 'today'.


Furthermore, I have added an extra column to the Calendar dimension, WorkingDayInMonth and this is a running number in the Calendar dimension that is raised by 1 of the day is a working day and not a holiday. Below is an example from the month December for which I have added some test data for the WorkingDayInMonth column.


By doing so, I can lookup the current working day that depends on the current day of the month. For instance, it's now December 14th and the current working day is 11. It is now possible to calculate the sales amount that is earned by the company and then calculate the extrapolated sales amount for the working days left in the current month.

I have added some extra measures to the Power Pivot workbook.

Today:=DATE(YEAR(NOW()),MONTH(NOW()),DAY(NOW()))

WorkingToday:=LOOKUPVALUE(Calendar[WorkingDayInMonth], Calendar[CalendarDate], Calendar[Today])

SalesEstimation:=IF(MONTH(NOW()) = MAX(Calendar[MonthNumber]), 
 DIVIDE(([SalesAmount] * [NumOfWorkingDaysIncHolidays]), [CurrentWorkingToday]),[SalesAmount]) 

The measure 'Today' is used by the other measure 'WorkingToday' for looking up in the Calendar dimension. The WorkingToday is the current working day in the current month. Perhaps you would like to limit this measure by the current month scope, but I will leave that up to you.

The measure SalesForecast calculates the estimated sales in the current month by using the following pseudo-formula:

EstimatedSales = SUM(SalesAmount/WorkingDaysSofar x NumOfWorkingDaysIncHolidays)

And this is the result of the calculation (I renamed SalesForecast to SalesEstimation):


At this point there is only one problem and that is the SalesEstimation on the Grand Total level.

In order to avoid confusion,  I added an extra IF to the measure :

SalesEstimation:=
IF(COUNTROWS(VALUES(Calendar[MonthNumber])) = 1, 
  IF(MONTH(NOW()) = MAX(Calendar[MonthNumber]), 
 DIVIDE(([SalesAmount] * [NumOfWorkingDaysIncHolidays]), [CurrentWorkingToday]),[SalesAmount]),
 BLANK()
)

Resulting in


Conclusion 

This blog post describes an implementation of a Daily Sales Report for a month with an estimation of sales amount in the current month.

Greetz
Hennie

zondag 13 december 2015

DAX: Using DAXStudio for building DAX expressions

Introduction

I was wondering how I could improve building DAX expressions and one way to do that is by using DAX Studio. DAX Studio gives you a richer developer experience than the standard DAX expression editor in PowerPivot.

On the blog of Marco Russo on SQLBlog.com you can find more information about using DAX Studio for building DAX expressions.

Define Measure

In order to use this technique you have to use the following pattern to make it work:

1. Define the measure.
2. Use this measure in you calculation.

Here is an example:

  
DEFINE MEASURE Sales[MTDInvoicedSales] = CALCULATE([TotalInvoicedSales], DATESMTD(Calendar[Date]))
EVALUATE
SUMMARIZE (
Sales,
Calendar[YYYYMM],
"InvoicedSales", Sales[MTDInvoicedSales]
)
 

And below depicted in a printscreen:


Conclusion

Use DAX studio when you are developing DAX Expressions with PowerPivot in Excel.

Greetz,
Hennie

PowerPivot : Backing up your measures

Introduction

A small blogpost about backing up your DAX Measures of PowerPivot in Excel 2013. Although PowerPivot is a great tool, it can happen that PowerPivot crashes, for instance when the underlying data model changes. I do find this a problem and one way to avoid a lot of rework is by backing up your DAX Measures.

Back up your DAX measures

1. The first thing to do is downloading and install the add-in "DAX Studio". If you open Excel you can find the add in on the ADD-INS ribbon.


2.Connect to the WorkBook and choose PowerPivot Model (default) when you open the DAX Studio from Excel.


3.Query the MDSchema (you can find al kinds of DMV's on the DMV tab.

       
select MEASURE_NAME, EXPRESSION from $SYSTEM.MDSCHEMA_MEASURES
 

and a printscreen is depicted below:


4. Copy and paste the formulas into Excel
And can copy and paste the formulas in an excel sheet and you can use this also as documentation.


Conclusion

It's a good thing to back up your DAX measures when the underlying datamodel is likely to change. One another point is that you can adopt this method for documenting the worksheet.

Greetz,
Hennie

vrijdag 31 juli 2015

Installing PowerBI Desktop V2

Introduction

This week PowerBI Desktop (formerly known as Power BI designer) is released by Microsoft, in case you haven't noticed by now;-) this Desktop version is the Self Service BI stack and is the counterpart of the more IT related stack SSIS, SSRS and SSAS. This new BI suite (PowerBI Desktop) is combination of PowerQuery, PowerPivot, PowerMap and PowerView. One of  the reasons that PowerBI Desktop is a separate solution, is because of the slow release cycles of the Power tooling in Microsoft Office (because of the huge install base of Office extensive testing has to be done in order to release a new version). With PowerBI Desktop faster new versions of the Power tooling is possible.

In this blogpost I'll describe the intallation process of PowerBI Desktop. In later blogposts I'll dive deeper into the functionality of PowerBI Desktop and DAX.

Installation

1. First download the PowerBI Desktop to your system. The start the PBIDesktop_x64.msi (In my case). Then click on Run to start the installation process.


Wait until the initialisation process has ended.


2. Click on Next to begin the installation process.


3. Accept and click on Next


4. Determine the installation path and enter Next


5. Click on the Install button.


The installation process continues with installing the files.


6. The installationprocess has ended and now you have to click on the Finish button.


PowerBI is starting up now


The starting window is opened and ready for usage.


Conclusion

First impression of Power BI Desktop are great. Looking forward to work with PowerBI Desktop
in projects....

Greetz,
Hennie

dinsdag 14 april 2015

Some features of SQL Server Data Tools

Introduction

Today a post about SSDT (SQL Server Data Tools) and this tool is the replacement of BIDS and Database Developer (or Data Dude). There are two tastes of SSDT: SSDT-BI and SSDT-DB. Both have to be installed seperately and that's very confusing. But once you know what's going on there are no problems anymore. SSDT-DB is the evolution of  "Visual Studio Team System Edition for Database Professionals" and this project was the baby of Gert E. Drapers that gave it its more common name, "Data Dude".

There seems multiple versions of SSDT around and I've found these versions of SSDT of the last years.
  • 2014 January update.
  • 2014 July update.
  • 2015 February update.

There are two versions available:
  • Visual Studio 2012.
  • Visual Studio 2013.
The ultimate goal of SSDT is to create a more integrated development environment. Traditionally, database development has often been done outside of Visual Studio, for instance in SQL Server Management Studio. With SSDT, database development is instead done inside Visual Studio. Databases are included as projects in the Visual Studio solutions.


What is SSDT?

This tool is the single environment for writing DB code as well as BI development. There is no need to switch between  SSMS and SSDT. You can write all the code in Visual Studio 2012 or 2013. There is now a clear distinction between a developer environment and a DBA environment. SSMS is more about managing SQL Server and databases. There are two modes possible:
  • Disconneted mode.
  • Connected mode
    • On premise.
    • Off premise.
There is a local database for developers and this comes in handy because developers don't need a connection to a live database. so you write code in a declarative manner and you don't need to worry(?!) about implementing these chnges on a database.


Normally, until you had SSDT, you would write code with SSMS in a development environment. When you needed to deploy the code to another environment you had to remember or compare the versions with TFS and then create change scripts for the other environment. With SSDT you don't need that anymore. SSDT does that for you.

Options

There are multiple ways to start a project with SSDT:
  • Start from scratch with a project in SSDT
  • Import the code from a current database into SSDT project.
  • Import from a .dacpac file
  • Import a from scriptfiles. 
In the following tutorial I will show some simple steps importing the code from an existing database into a project in SSDT. This is the DB part of SSDT.

Import the code from a current database into SSDT project

1. First start SSDT and start a new project and you'll see the following window. Here you can see the distinction between BI and DB.


2. Export the Data-tier Application from the database by right clicking on the specific database, press Tasks and Export Data-tier Application.

3. Press Next.


4. Save the file to a local disk by clicking on Browse


5. Choose the location and press Save.


6. Press Next.


7. Choose the database objects and press Next


8. Now we have the summary window. Press Finish.


9. Errors appears and why is that?


There seems a lot of errors in export of the database to the bacpac file, unfortunately. The errors are static and you can do anything about it. Below,  I copied the most common errors that apeared in the error list

The element Extended Property: [dbo].[ufnGetCustomerInformation].[@CustomerID].[MS_Description]

The element Extended Property: [SalesLT].[SalesOrderDetail].[IX_SalesOrderDetail_ProductID].[MS_Description] is not supported

The element XML Schema Collection: [SalesLT].[ProductDescriptionSchemaCollection] is not supported

Element Column: [SalesLT].[Address].[AddressID] has an unsupported property IdentityIsNotForReplication

 Element Column: [SalesLT].[Address].[rowguid] has an unsupported property IsRowGuidColumn set 

Table Table: [dbo].[BuildVersion] does not have a clustered index.  Clustered indexes are required for inserting data in this version of SQL Server.

Element User: [NT AUTHORITY\NETWORK SERVICE] has an unsupported property AuthenticationType set and is not supported when used as part of a data package.   


When searching the internet I found this helpful article on SQL Server Data Tools Team Blog. It seems that there is another way of importing the database into SSDT-DB. And that is with SSDT-DB itself.

10. Select the specific database and right click on Create New Project


11. Set the Target name and click on Start


12. The export is running


13. And, the project is created based on the AdventureWorks2012LT database.


Refactor the database

Refactoring the database is one of the things that needs to be done. Objects needs to be changed when the world around us changes and database needs to evolve with that. Let's try to refactor a field in table in the AdventureWorksLT2012 database.

14. Let's try to change the CompanyName in the Customer script to Company and try to publish this to the database. We do this by right clicking on the CompanyName and press Refactor. Change the name to Company.


15. Here you can see the changes and the press Apply


16. The next thing is to publish the changes to the database. You do this by right clicking on the Project and press Publish.


17. After some time of processing the changes are processed and the database is in the new state.


Snapshot the project

It's also possible to snapshot your project in dacpac files. These files contains your scripts saved at a certain point in time. This will help you save the projects at important points in time.


18. Right click on the project and click on Snapshot Project.


19. And the snapshot is saved under Snapshots.


Using References

If your database references other databases, you'll need a dacpac file for each external database referenced in your code. References can be resolved for objects in one of the following locations:

  • In the referencing database.
  • In a database other than the referencing database, but on the same server.
  • In a database other than the referencing database, on a different server.

In this blogpost, I've choosed to use "In a database other than the referencing database, but on the same server".

Suppose you have a stored procedure in a project that references a table in an other database (e.g. TestDB). Then the following error is shown in SSDT. You need to create a Database reference to the project.


22. Add a Database Reference to the project by right clicking References and Add Database Reference.


23. First extact a dacpac from the database in SSMS and store that on a central place and press Next.


24. Select that dacpac file from the central place in your project.


25. Replace the database name by the Database Reference.


25. Now if you want to publish this to the database, the values of the Database Reference can be set.


Here you can set the value for the Database reference.

Conclusion

SSDT is logical evolution in Database and SSIS, SSRS and SSAS design. I'm very happy with the development environment for SQL Server where you have an integrated approach. There is a clear distinction between DBA and Developer work.

Other references