dinsdag 22 april 2014

Datavault : Adaptability of the Datavault model (Part II)

Introduction

This is the second blogpost in a series about Datavault. The first blogpost in this series was about the basics of Datavault and in this blogpost I would like to discuss the adaptability of the datavault model. Why is Datavault an adaptive method for designing your datawarehouse? I think there are three reasons why Datavault is an adaptive Datamodel approach:
  1. A fundamental reason: Separating the keys, relationships and the descriptive data in separated tables enhances the flexibility and agility of the model.
  2. You can easily add Satellites (within a Concept) to the model without breaking the existing model.
  3. You can easily add Links (a new Concept or a new Concept Constellation) to the model without altering the existing model.

In this blogpost I'll discuss the adaptive characteristics of the datavault model in more depth..

Adding Satellites

A satellite doesn't contain businesskeys. It stores (all)  information about the businesskey (hub) and historizes all the information about the concept. It inherits the surrogate key of the hub (or link). In order to historize, the primary key is extended with a Date/Time Stamp. In this way the Satellite acts as a Type II dimension (SCD2). The Satellite stores every change that happens in the source.


Now let's see what happens when structural changes happens in a operational system that acts as a source for a datavault data warehouse.

1) Initial situation. 
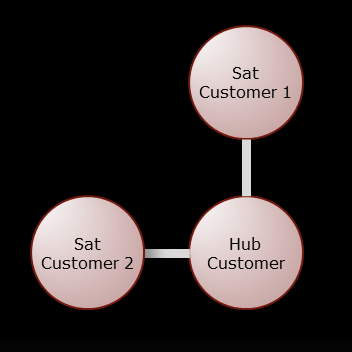
In this initial situation there is a hub and one satellite. This situation occurs most often during the start of a data warehouse in a production state. The hubs and satellites are designed and ready for usage.


2) Extra attributes added to a table in the sourcesystem.
Now, something happens in the operational system. Some tables are extended with extra fields. These extra fields should be propagated to the data warehouse. Now, the strength of the data vault model shows up. Nothing changes to the exisiting model. The extra fields should not be integrated in the existing satellite but create a new satellite and add this to the hub. Integrating the fields in the existing satellite causes difficulties like dropping and recreating the table.


On Linkedin I had a discussion about changing source systems..I'll blog about this in the future.

Adding Links

The same is true for links. The hubs are the anchors of the model. These anchors provide steadyness of the model and anchors provide satellites and links with surrogate keys. Below and example of a link table and a hub table. The hub provides the link with a surrogate key and this principle helps to connect other concepts and other concept constellations (see part I).


Suppose you have the following situation. There is an old piece of data warehouse and a new piece (concepts) of data warehouse is build.


Now another advantage of the Datavault comes into play. The new concept is linked by the link tables with the old piece of the data warehouse. And, nothing changes in the current datawarehouse. Starmodels, reports and analysis build on top the Datavault model continues to function properly.


Conclusion

The Datavault model is adaptive because of the separation of the businesskeys, the relations and the descriptive information. If you condense the data like the star model, the model will become less adaptive. It will be harder to change the model. By separating the different kinds of data, the model become more resilient to changes. By adding satellites and links to the model and not changing current satellites and links (and hubs) the current reports and (user) queries will remain running. This way the datavault model lends itself for extending the model without breaking the current model. 


The star schema is less flexible for storing datawarehouse information because we have only two flavours: Facts and dimensions. Therefore Datavault is more suitable for storing datawarehouse information than star schemas.

Greetz,
Hennie

vrijdag 18 april 2014

Hadoop summit 2014 review

Introduction

Couple of weeks ago I joined the Hadoop summit 2014 in Amsterdam. I enjoyed most of the sessions and I've learned new stuff and it gave me more insights in the usage of Hadoop.The world of data is changing and it will happen fast, as it seems, according to some speakers at the Hadoop Summit. The data paradigm is shifting from Schema-on-Write (RDBMS) to Schema-on-Read (Hadoop). This paradigm shift is happening at this moment. We will see for certain types of data the Schema-on-Read will become popular in favorite of Schema-on-Write solutions. Most of these types of data are unstructured or semi-structured.

And, it's not about new technology replacing old technology, it's also about creating new businesses with new technology. With Hadoop there are new business opportunities possible with new ways of developing business models based on Hadoop and together with RDBMS solutions (for now).


DataOS

With the launch of YARN (Yet Another Resource Negotiator) the name of DataOS appeared. YARN is called DataOS. In 2012, YARN became a sub-project of the Apache Hadoop project. YARN is a software rewrite that decouples MapReduce's resource management and scheduling capabilities from the data processing component. This enables Hadoop to support more different processing approaches and a broader array of applications.


RDBMS living together with HADOOP

How about RDBMS and Hadoop?  YARN replaces Mapreduce and it isn't a batch oriented system but also a real time solution. Storm is an example of this. I think dat future developments of Hadoop will lead to a change of the design of the Enterprise Data Warehouse. But for now, in the referential architecture of Hortonworks RDBMS and Hadoop live together and they both borrow data from each other. The photo below shows you this (sorry for the bad photo).


This is also the case with the PDW v2 solution of Microsoft. In this appliance Microsoft already sells Hadoop as an integrated part. Polybase is the layer that abstracts the Hadoop and the MS nodes. So, In one solution a RDBMS and a Hadoop solution with an uniform layer. That's nice.


Conclusions

The Open source community of Hadoop has become huge and practically every vendor embraces this new technology. Microsoft gave up there Hadoop look-a-like software (Bing) and has embraced Hadoop and integrated this in PDW v2 (The modern Datawarehouse). There are new Hadoop developments like YARN, Stinger, TEZ, Storm.

As for integrating Hadoop into your Enterprise Data warehouse I can imagine that Hadoop will become a base for capturing raw data into a (historically) Staging Area. Hadoop is about storing Raw data and it's cheap. You can Build on top of that a Business datawarehouses and a discovery- and analytical platform for analyzing structured and unstructured data.

Greetz,

Hennie

zondag 2 maart 2014

SQL Server : Execution plans - Table Queries - Clustered Index Scan (part I)

Introduction

One area that I have to discover in more depth are execution plans in SQL Server.  For some reason a query at my customer doesn't use an index in a query. We don't know why and that triggered me studying execution plans in more detail. So I will write some blogposts about the execution plan in the future. The first blogpost is about the Clustered Index scan.

Clustered Index scan

On of the common operators is the Clustered Index Scan. This happens when no filter is added in the WHERE clause, for instance. In this example I've queried the Product Table and a clustered Index Scan occurs.


In the tooltip the Object tells you that PK_Product_ProductID is scanned. Other interesting properties are Actual Number of rows and Estimated Number of Rows. If these differs the statistics may be out of date. 

An Index Scan happens when the optimizer decides that there are some many rows to return that it's quicker to scan all the values in the index rather than using the keys that are provided by the index.If the Scan returns more rows than expected then this operator can be optimized.

What is the difference between a Index scan and a Table Scan? In a table without a clustered index, data pages are not linked together and when an clustered index is present, the pages are linked together and makes scans a bit faster than a heap table.

Below a table that distinquishes the different types of operations...

 
Scan
Seek
Heap
Table Scan

Clustered Index
Clustered Index Scan
Clustered Index Seek
Non-clustered Index
Index Scan
Index Seek
Borrowed from Craig freedmans blog

Here is some more info about scans


Conclusion

A clustered Index scan is needed when all the data is needed in the query, but can be optimized when a filter is used that could result in a index seek. Is a index scan bad? Hmmm not if you need all the data.

Greetz,

Hennie

zondag 12 januari 2014

R : An introduction (Part I)

Introduction

Today a blogpost about R. R is a Statisitcal Programming Language and can be downloaded from the CRAN site. From Wikipedia : R is a free software programming language for statistical computing and graphics and it seems that R is widely used among statisticians and Data miners. R is an implementation of the S programming language. I was curieus about the name R and it seems that it's named after first names of the first authors of R.

Installation of R and RStudio

In this blogpost I'll write about the installation of R studio and some small examples. This is a very popular IDE environment and provides a powerful and productive user interface for R. It's free and open source , available for Windows, Max and Linux. But before you can use R studio you need install R. If you don't, you'll recieve the following message:


For this blogpost I've installed the following software:
  • R (version 3.0.2). This is the console application and has some basic functionality and it seems to be differ between the operating systems.
  • R Studio (version 0.98). R Studio is cross platform application that can be used for analysis. 


R studio

When you have started R studio the following window appears.


Here is a screenshot of some expressions I've borrowed from Wikipedia.


There are some pre installed datasets in R and one of them is "cars". This is a set of data containing the braking distances that were recorded for cars travelling at different speeds. I've tried some graphics.


Conclusion

R Studio is a great tool for analyzing datasets with R. There is a lot of information available on the internet that will help you learn R. Here is a good resource : Wikibooks.

Greetz,
Hennie

woensdag 1 januari 2014

Datavault : The basics (Part I)

Introduction

I've blogged about Datavault in my earlier blogposts (e.g. Four different datamodeling methods). I've looked at different tooling that are available on the market like Quipu and I've blogged about that too. Now, I've had the change to gain some hands-on experiences during a long-term project where I've implemented several Datavault datamodels. I want to share my experiences about Datavault modeling with you. 

This the first blogpost of the Year 2014 and I wish everyone a pleasant and an information wise year!

In this blogpost I'll define Datavault, the Hubs, the Links, the Satellites, Concepts and Concept Constellations. All this information is gathered from seminars (Data modelling Zone Hannover 2013 (BIPodium), Datavault Automation), courses (DV Certification(Centennium) and Advanced Datavault modeling (BIPodium)) and books ("Supercharge your data warehouse" By Dan Linstedt, "Modeling the agile data warehouse with Datavault" by Hans Hultgren and "The Integrated Data Hub" by Dario Mangano). These resources gives you a thorough understanding of Datavault modelling.

In this blogpost I'll build up a simple diagram of a Datavault model. In a few steps W'll enhance a datavault model to a high level diagram that will help you understand the concepts around DataVault. And, it will also help you understand how to build a datavault model.

Datavault

What is Datavault? Datavault is a modeling method used to design a datawarehouse and more specifically an enterprise datawarehouse. The modeling approach is very well suited for building and maintaining a flexible and agile datawarehouse. 

Hans Hultgren talks in his book "Modeling the agile data warehouse with Datavault" about the concept unified decomposition and that seems a true observation of him. An entity in a logical model is split into multiple tables in the physical model but it acts as a whole, an unification of a concept (the entity in the logical model).

The datavault model consists of three basic entity types: Hubs, Links and Satellites. Hubs contains the business keys, Links connects the hubs and the satellites contains the descriptive data about the businesskeys. Together, they build up the Datavault model.

Hubs

As said earlier, Hubs are the business keys, an unique list as Dan Linstedt states in his book "Supercharge your Data warehouse". The Hub is a single table with one or multiple columns with businesskeys. It records the business keys and stores them uniquely. Examples are Social Security Number, LicenseNumber, VehicleIdentification, EmployeeNumber, etc.

And in the process building a Datavault model it's the first step to determine the businesskeys and the correpsonding Hubs. During the analysis of the businessproblem you go and try to find a proper businesskey. 

Here is the first diagram with the Hubs. I've also adapted the color scheme of Datavault.


Links

Links defines the relation between the businesskeys. They give the datavault model the flexibility to extend with other concepts. This type of Datavault entity gives the ability to extend the model in the future when new data should be integrated in the model. This really enhances the maintenance of the model. Examples of this type of Datavault entity are Customer/Sales or CustomerCategory/Category. 

The second step designing the Datavault model is determining the Link entities. These tables are n:m associative entities that are in fact n:m relationtables. This has a little drawback because you can'see on the outside of Link entity whether the underlying logical model is in fact a 1:n relation. This information is implicit. But, it gives you also an advantage. When the relation changes from 1:n to n:1 the Datavault model still remains the same.

Here is the Datavault model with links added


Satellites

Satellites addse descriptive information to the model. These tables contains the descriptive information and the history of the datavault model. These tables gives your model the datawarehouse capability.  Examples are Customer information like name, address, telephonenumber or Sales information like Orderdate, Amount, etc.


Concepts

Dan talked about this in his book and is more in detail described in the book of Hans: Concepts. Concepts are comparable with entities in the logical model. For instance, Customer, Sales, Employee, EmployeeCategory. In the physical model they do don't have any meaning but they help you understand the datavault model. 


Concept Constellations

A new idea is Concept Constellation by Hans Hultgren described. This groups the different concepts together into a higher level meaning. For instance, suppose we have the concepts Employee, EmployeeCategory, EmployeeWhatever, these concepts tell you something about the Concept Constellation Employee. Employee is a higher level definition of all the Hubs, Links, Satellites stores all the information of the different aspects of  an Employee.


Conclusion

This blogpost describes the basics of the Datavault modeling. There is a lot more information available about other types of tables but they all are based on these three types of tables. The strength in the model is by separating the business keys, relations and descriptive information flexibility is introduced. As I'll show you in future blogposts you can easiliy add new descriptive information (satellite) or new concepts to the Datavaultmodel (link).

Greetz
Hennie