dinsdag 23 september 2014

SSAS : Multicurrency Problem (Part II)

Introduction

In this blogpost I'll improve the solution of the multicurrency problem I've written in the first blogpost (part I). In the first part about the MultiCurrency problem there were a couple of problems and improvements possible:
  • The implementation is not a typical Dimension/Fact starschema. The CurrencyRate table is not a traditional Fact. The key of the Currency dimension is not a integer. I've changed that in this new version solution.
  • As in the blog of Chris schmidt described, the currency (cube)dimension can be improved in order to gain some performance speed.

Improved MultiCurrency Solution

For this purpose I've created a MultiCurrencyV2 Database and used the following script:

USE [MultiCurrencyV2]
GO

DROP TABLE [dbo].[FactOrderLine]
GO

DROP TABLE [dbo].[FactCurrencyRate]
GO

DROP TABLE [dbo].[DimProduct]
GO

DROP TABLE [dbo].[DimDate]
GO

DROP TABLE [dbo].[DimCurrency]
GO

CREATE TABLE [dbo].[DimCurrency](
 [Currency_ID] [int] NOT NULL,
 [Currency_Name] [varchar](50) NULL,
 CONSTRAINT [PK_Dimcurrency] PRIMARY KEY CLUSTERED 
(
 [Currency_ID] ASC
)WITH (PAD_INDEX = OFF, STATISTICS_NORECOMPUTE = OFF, IGNORE_DUP_KEY = OFF, ALLOW_ROW_LOCKS = ON, ALLOW_PAGE_LOCKS = ON) ON [PRIMARY]
) ON [PRIMARY]
GO

CREATE TABLE [dbo].[DimDate](
 [Date_ID] [int] NOT NULL,
 [Day] [varchar](50) NULL,
 [Month] [varchar](50) NULL,
 CONSTRAINT [PK_DimDate] PRIMARY KEY CLUSTERED 
(
 [Date_ID] ASC
)WITH (PAD_INDEX = OFF, STATISTICS_NORECOMPUTE = OFF, IGNORE_DUP_KEY = OFF, ALLOW_ROW_LOCKS = ON, ALLOW_PAGE_LOCKS = ON) ON [PRIMARY]
) ON [PRIMARY]
GO

CREATE TABLE [dbo].[DimProduct](
 [Product_ID] [int] NOT NULL,
 [Product_Name] [varchar](50) NULL,
 CONSTRAINT [PK_DimProduct] PRIMARY KEY CLUSTERED 
(
 [Product_ID] ASC
)WITH (PAD_INDEX = OFF, STATISTICS_NORECOMPUTE = OFF, IGNORE_DUP_KEY = OFF, ALLOW_ROW_LOCKS = ON, ALLOW_PAGE_LOCKS = ON) ON [PRIMARY]
) ON [PRIMARY]
GO

CREATE TABLE [dbo].[FactCurrencyRate](
 [CurrencyRate_ID] [int] IDENTITY(1,1) NOT NULL,
 [Date_ID] [int] NULL,
 [Currency_ID] [int] NULL,
 [Rate] [float] NULL,
 CONSTRAINT [PK_FactCurrencyRate] PRIMARY KEY CLUSTERED 
(
 [CurrencyRate_ID] ASC
)WITH (PAD_INDEX = OFF, STATISTICS_NORECOMPUTE = OFF, IGNORE_DUP_KEY = OFF, ALLOW_ROW_LOCKS = ON, ALLOW_PAGE_LOCKS = ON) ON [PRIMARY]
) ON [PRIMARY]
GO

CREATE TABLE [dbo].[FactOrderLine](
 [OrderLine_ID] [int] IDENTITY(1,1) NOT NULL,
 [Date_ID] [int] NULL,
 [Product_ID] [int] NULL,
 [Currency_ID] [int]  NULL,
 [Amount] [money] NULL,
 CONSTRAINT [PK_FactOrderLine] PRIMARY KEY CLUSTERED 
(
 [OrderLine_ID] ASC
)WITH (PAD_INDEX = OFF, STATISTICS_NORECOMPUTE = OFF, IGNORE_DUP_KEY = OFF, ALLOW_ROW_LOCKS = ON, ALLOW_PAGE_LOCKS = ON) ON [PRIMARY]
) ON [PRIMARY]
GO


INSERT INTO [dbo].[DimCurrency]
           ([Currency_ID],
      [Currency_Name])
     VALUES
           (1, 'EUR'),
     (2, 'GBP'),
     (3, 'USD'),
     (4, 'MEX')

-- [DimDate]
INSERT INTO [dbo].[DimDate]
           ([Date_ID],
      [Day],
      [Month])
VALUES
           (20140921, 'Sunday', 'September'),
     (20140922, 'Monday', 'September'),
     (20140923, 'Tuesday', 'September'),
     (20140924, 'Wednesday', 'September'),
     (20140925, 'Thursday', 'September'),
     (20140926, 'Friday', 'September'),
     (20140927, 'Saturday', 'September')

--[DimProduct]
INSERT INTO [dbo].[DimProduct]
           ([Product_ID],
      [Product_Name])
     VALUES
           (1, 'Bicycle'),
     (2, 'Car'),
     (3, 'Motor'),
     (4, 'Bus')

INSERT INTO [dbo].[FactCurrencyRate]
           ([Date_ID]
           ,[Currency_ID]
           ,[Rate])
     VALUES
           (20140921, 1, 1.0), --EUR
     (20140922, 1, 1.0), --EUR
     (20140923, 1, 1.0), --EUR
     (20140924, 1, 1.0), --EUR
     (20140925, 1, 1.0), --EUR
     (20140926, 1, 1.0), --EUR
     (20140927, 1, 1.0), --EUR
     (20140921, 2, 1.25), --GBP
     (20140922, 2, 1.27), --GBP
     (20140923, 2, 1.30), --GBP
     (20140924, 2, 1.32), --GBP
     (20140925, 2, 1.40), --GBP
     (20140926, 2, 1.21), --GBP
     (20140927, 2, 1.22), --GBP
     (20140921, 3, 0.77), --USD
     (20140922, 3, 0.80), --USD
     (20140923, 3, 0.62), --USD  --xx
     (20140924, 3, 0.90), --USD
     (20140925, 3, 0.66), --USD
     (20140926, 3, 0.33), --USD
     (20140927, 3, 0.90), --USD
     (20140921, 4, 0.06), --MEX
     (20140922, 4, 0.10), --MEX
     (20140923, 4, 0.05), --MEX
     (20140924, 4, 0.11), --MEX
     (20140925, 4, 0.12), --MEX
     (20140926, 4, 0.14), --MEX
     (20140927, 4, 0.15) --MEX
GO

INSERT INTO [dbo].[FactOrderLine]
           ([Date_ID]
           ,[Product_ID]
           ,[Currency_ID]
           ,[Amount])
     VALUES
           (20140922, 1, 1, 5), 
     (20140922, 1, 1, 7.7),
     (20140922, 2, 2, 8.95),
     (20140925, 1, 1, 5),
     (20140923, 2, 3, 100),  -- 0,62 * 100 = 62
     (20140921, 1, 1, 500),
     (20140925, 1, 1, 1000),
     (20140926, 4, 4, 300)
GO


In this blogpost I'll recreate the Cube and I'll show the enhancement I've made to this MultiCurrency Problem. The starting situation is that the Datasource and the DataSourceView are already existing.

Take the following steps:

1. Run the New Cube wizard and create the Cube and the three dimensions Date, Currency and Product.  The cube should like this:


2. Start the Business Intelligence wizard on the cube and press Next in the Business Intelligence Wizard opening window.

3. Select "Define Currency Conversion" and press Next.

An error because the wizard can't determine the Currency dimension.That's because we didn't Type the Currency dimension as a Currency.


4. Press Cancel.

5. Edit the properties of the Currency dimension by right clicking on the Currency dimension  choose properties.

6. Select the Currencyname and select the Type property and change this to Currency>Currency>CurrencyName.

7. Change the property IsAggregatable of the attribute Currency Name to False.

8. Change the property Usage to key of the attribute Currency Name.

9. Change the property KeyColumns to Currency ID.

10. Change the property NameColumn to Currency Name.

11. Red squirels now occur under CurrencyName and the dimension name Currency. Solve this by removing the attribute CurrencyID.

The next step is defining the granularity of the Measuregroups for the Currency Dimension again.

13. Let's try to run the Business Intellligence wizard again on the cube but now an error happens because of the lack of a Time Type dimension.


14. Change the property Type of the Date dimension to Time, change the Type of Day to DayOfWeek and the Type of the attribute Month to MonthOfYear.

15. Start the Business Intelligence wizard of the Cube again and change the setting according the following window:


16. Press Next.

17. Select Amount and change the Exchange Rate Measures to Rate.


17. Select Many to Many and click Next.


18. In the "Define Local Currency Reference" Window a link between the local currency and the transaction is selected.


19. In the "Specify Reporting Currencies" Window select All of the Reporting Currencies and press Next.


20. On the Completing the Wizard page, in the Changes pane, you can see the changes that are being made by the Business Intelligence wizard to the Datasource view, dimensions and the Cube. Press Finish.


Now, we are done. The Dimension usage tab, the Datasource View and the Calculations looks the same as the ones that I've described in Part I of the MultiCurrency problem.

Let's check whether this is correct:


And this is the same as in the Part I of the Multicurrency series.

Conclusion

This solution is a better solution because the solution is a typical starschema now, and the cube is more optimized and therefore has a better performance.

In my next blogpost about the multicurrency problem I'll show you an even faster solution. This solution is proposed by Chris Webb. He said that the generated MDX script by the business Intelligence wizard is terrible (his words). That's because of the LinkMember function.

Greetz,

Hennie


zondag 21 september 2014

SSAS : Multicurrency Problem (Part I)

Introduction

Suppose, you're working for an international company in Europe and this company has many branches across the world. These branches are located in countries with different currencies. Therefore, this multinational company book her transactions in local currencies. This blogpost is about how to handle multicurrency in a SQL Server Analysis Services environment.

Now, the first thought solution is to introduce two columns in the fact table, in case you've a Kimball data warehouse, off course.  But, suppose there are region managers in countries who are responsible for the sales in other countries. And the region manager reports in it's own currency (let's say American Dollars). The region manager is also responsible for Mexico. The currency of Mexico is Pesos. Now, the region manager wants to see the sales in American Dollars of the countries he is responsible for. The pesos should be converted into American Dollars. The head office of this multinational company is in the Netherlands and they report in Euros.

This blog post is about collecting the sold products and services in a local currency and convert it to any other currency that is desired. So, this is in my opinion the most flexible solution. In this way, we can handle very easily organization changes, for instance, like that region management is moved from USA to Mexico. Now, the American Dollars and Pesos can now easily consolidated into Pesos.

Overall, there are a couple of scenarios possible:
  1. Data is collected in one currency and it must be converted into multiple currencies (website scenario).
  2. Data is collected in multiple currencies and it must be converted into one currency (headquarter scenario).
  3. Data is collected in multiple currencies and it must be converted into multiple currencies (subsidiary and multiregion scenario).
In this blogpost I'll discuss option number 3.

And, there are a couple of solutions:
  1. Create multiple currency columns (EURO, USD, etc) in the fact and convert the local currency into the columns. The advantage is that it's simple. Disadvantage is that it's fixed.
  2. Convert the different currencies into an base currency during the ETL, and build multicurrency conversion in the cube. This is more complex than number 1 option.
  3. Import the different currencies into the cube and convert the currencies at query time. This is the most complex conversion solution but also a neat one!
I'll take number 3!

For this blogpost I've used the book "Expert Cube Development with SQL Server 2008 Analysis Services" by Chris Webb, Alberto Ferrari and Marco Russo. In Chapter 7 an explanation is given about MultiCurrency problems. Now as you are googling about MultiCurrency the proposed MDX Script isn't the best generated solution (in any way for the Many2Many way) and better and more performant solutions are available. I'll blog about them in future blogpost. So be aware!

For this blogpost I've used SQL Server 2008 R2 and Excel 2013.

MultiCurrency Problem

In this blogpost I'll write down a solution that worked for me in a lab experiment. In future blogposts I'll investigate improvements of the base solution I'll present here. In the base solution, there a couple of tables needed:
  • FactOrderLine.
  • DimProduct.
  • DimDate.
  • CurrencyRate.
  • Currency.
I've created a database "MultiCurrency" and ran the script below.

USE [MultiCurrency]
GO

DROP TABLE [dbo].[FactOrderLine]
GO

DROP TABLE [dbo].[CurrencyRate]
GO

DROP TABLE [dbo].[DimProduct]
GO

DROP TABLE [dbo].[DimDate]
GO

DROP TABLE [dbo].[DimCurrency]
GO

CREATE TABLE [dbo].[DimCurrency](
 [Currency_ID] [varchar](50) NOT NULL,
 [Currency_Name] [varchar](50) NULL,
 CONSTRAINT [PK_Dimcurrency] PRIMARY KEY CLUSTERED 
(
 [Currency_ID] ASC
)WITH (PAD_INDEX = OFF, STATISTICS_NORECOMPUTE = OFF, IGNORE_DUP_KEY = OFF, ALLOW_ROW_LOCKS = ON, ALLOW_PAGE_LOCKS = ON) ON [PRIMARY]
) ON [PRIMARY]
GO

CREATE TABLE [dbo].[DimDate](
 [Date_ID] [int] NOT NULL,
 [Day] [varchar](50) NULL,
 [Month] [varchar](50) NULL,
 CONSTRAINT [PK_DimDate] PRIMARY KEY CLUSTERED 
(
 [Date_ID] ASC
)WITH (PAD_INDEX = OFF, STATISTICS_NORECOMPUTE = OFF, IGNORE_DUP_KEY = OFF, ALLOW_ROW_LOCKS = ON, ALLOW_PAGE_LOCKS = ON) ON [PRIMARY]
) ON [PRIMARY]
GO

CREATE TABLE [dbo].[DimProduct](
 [Product_ID] [int] NOT NULL,
 [Product_Name] [varchar](50) NULL,
 CONSTRAINT [PK_DimProduct] PRIMARY KEY CLUSTERED 
(
 [Product_ID] ASC
)WITH (PAD_INDEX = OFF, STATISTICS_NORECOMPUTE = OFF, IGNORE_DUP_KEY = OFF, ALLOW_ROW_LOCKS = ON, ALLOW_PAGE_LOCKS = ON) ON [PRIMARY]
) ON [PRIMARY]
GO

CREATE TABLE [dbo].[CurrencyRate](
 [CurrencyRate_ID] [int] IDENTITY(1,1) NOT NULL,
 [Date_ID] [int] NULL,
 [Currency_ID] varchar(50) NULL,
 [Rate] [float] NULL,
 CONSTRAINT [PK_CurrencyRate] PRIMARY KEY CLUSTERED 
(
 [CurrencyRate_ID] ASC
)WITH (PAD_INDEX = OFF, STATISTICS_NORECOMPUTE = OFF, IGNORE_DUP_KEY = OFF, ALLOW_ROW_LOCKS = ON, ALLOW_PAGE_LOCKS = ON) ON [PRIMARY]
) ON [PRIMARY]
GO

CREATE TABLE [dbo].[FactOrderLine](
 [OrderLine_ID] [int] IDENTITY(1,1) NOT NULL,
 [Date_ID] [int] NULL,
 [Product_ID] [int] NULL,
 [Currency_ID] varchar(50)  NULL,
 [Amount] [money] NULL,
 CONSTRAINT [PK_FactOrderLine] PRIMARY KEY CLUSTERED 
(
 [OrderLine_ID] ASC
)WITH (PAD_INDEX = OFF, STATISTICS_NORECOMPUTE = OFF, IGNORE_DUP_KEY = OFF, ALLOW_ROW_LOCKS = ON, ALLOW_PAGE_LOCKS = ON) ON [PRIMARY]
) ON [PRIMARY]
GO


INSERT INTO [dbo].[DimCurrency]
           ([Currency_ID],
      [Currency_Name])
     VALUES
           ('EUR', 'EUR'),
     ('GBP', 'GBP'),
     ('USD', 'USD'),
     ('MEX', 'MEX')

-- [DimDate]
INSERT INTO [dbo].[DimDate]
           ([Date_ID],
      [Day],
      [Month])
VALUES
           (20140921, 'Sunday', 'September'),
     (20140922, 'Monday', 'September'),
     (20140923, 'Tuesday', 'September'),
     (20140924, 'Wednesday', 'September'),
     (20140925, 'Thursday', 'September'),
     (20140926, 'Friday', 'September'),
     (20140927, 'Saturday', 'September')

--[DimProduct]
INSERT INTO [dbo].[DimProduct]
           ([Product_ID],
      [Product_Name])
     VALUES
           (1, 'Bicycle'),
     (2, 'Car'),
     (3, 'Motor'),
     (4, 'Bus')

INSERT INTO [dbo].[CurrencyRate]
           ([Date_ID]
           ,[Currency_ID]
           ,[Rate])
     VALUES
           (20140921, 'EUR', 1.0), --EUR
     (20140922, 'EUR', 1.0), --EUR
     (20140923, 'EUR', 1.0), --EUR
     (20140924, 'EUR', 1.0), --EUR
     (20140925, 'EUR', 1.0), --EUR
     (20140926, 'EUR', 1.0), --EUR
     (20140927, 'EUR', 1.0), --EUR
     (20140921, 'GBP', 1.25), --GBP
     (20140922, 'GBP', 1.27), --GBP
     (20140923, 'GBP', 1.30), --GBP
     (20140924, 'GBP', 1.32), --GBP
     (20140925, 'GBP', 1.40), --GBP
     (20140926, 'GBP', 1.21), --GBP
     (20140927, 'GBP', 1.22), --GBP
     (20140921, 'USD', 0.77), --USD
     (20140922, 'USD', 0.80), --USD
     (20140923, 'USD', 0.62), --USD
     (20140924, 'USD', 0.90), --USD
     (20140925, 'USD', 0.66), --USD
     (20140926, 'USD', 0.33), --USD
     (20140927, 'USD', 0.90), --USD
     (20140921, 'MEX', 0.06), --MEX
     (20140922, 'MEX', 0.10), --MEX
     (20140923, 'MEX', 0.05), --MEX
     (20140924, 'MEX', 0.11), --MEX
     (20140925, 'MEX', 0.12), --MEX
     (20140926, 'MEX', 0.14), --MEX
     (20140927, 'MEX', 0.15) --MEX
GO

INSERT INTO [dbo].[FactOrderLine]
           ([Date_ID]
           ,[Product_ID]
           ,[Currency_ID]
           ,[Amount])
     VALUES
           (20140922, 1, 'EUR', 5), 
     (20140922, 1, 'EUR', 7.7),
     (20140922, 2, 'GBP', 8.95),
     (20140925, 1, 'EUR', 5),
     (20140923, 2, 'USD', 100),  -- 0,62 * 100 = 62
     (20140921, 1, 'EUR', 500),
     (20140925, 1, 'EUR', 1000),
     (20140926, 4, 'MEX', 300)
GO

SELECT D.Currency_Name, Sum(F.[Amount])
FROM FactOrderLine F
LEFT OUTER JOIN [DimCurrency] D ON F.Currency_ID = D.Currency_ID
GROUP BY D.Currency_Name


Now start SQL Server Analysis Services and create a Datasource:

1. Create a New project in SQL Server Analysis Services.

2. Name it MultiCurrency and press OK.

3. Create a Datasource by richtclicking in the in the Solution Explorer (on the right side of Microsoft Visual Studio).

4.  The DataSource Wizard is started and press Next.

5. Create a new connection by pressing New.

6. Enter . at the server name and select the right database "MultiCurrency".

7. Press Next.

8. Select Use the Service Account at the Impersonation Information Window.

9. Enter "dsMultiCurrency" at the Data Source Name.


The next step is creating a Data source view:


10. Right click in the Solution explorer on Data Source Views. (on the right side of Microsoft Visual Studio)

11. Press Next when the wizard opens.

12. Select the Datasource and press Next

13.  Press Next in the Name Matching window.

14. Select all tables in the Available objects, press > button and press Next.

15. Name the DataSourceView "dsvMultiCurrency".


This is the Data Source View :


Okay let's create the dimensions:

16. In Solution Explorer (on the right side of Microsoft Visual Studio), right-click Dimensions, and then click New Dimension. The Dimension Wizard appears.

17. On the Welcome to the Dimension Wizard page, click Next.

18. On the Select Creation Method page, verify that the Use an existing table option is selected, and then click Next.

19. On the Specify Source Information page, verify that the dsvMultiCurrency data source view is selected.

20. In the Main table list, select DimDate.

21. Click Next.

22. On the Select Dimension Attributes page, select the check boxes next to the following attributes:
  • Day
  • Month

23. Change the setting of the Day attribute's Attribute Type column from Regular to Day of week.To do this, click Regular in the Attribute Type column. Then click the arrow to expand the options. Next, click Date > Calendar > Day of Week. Click OK.


24. Do this also for Month. Change Attribute Type to Month.

25. On the Completing the Wizard page, in the Preview pane, you can see the Date dimension and its attributes.

26. Click Finish to complete the wizard.

27. In the Solution Explorer, in the MultiCurrency project, the Date dimension appears in the Dimensions folder.

28. On the File menu, click Save All.

Now do the other dimensions. Don't forget to make special adjustments for the Currency dimension.

For the Currency dimension:

29.   Change the setting of the CurrencyID attribute's Attribute Type column from Regular to Currency ISO Code.To do this, click Regular in the Attribute Type column. Then click the arrow to expand the options. Next, click Currency>Currency>Currency ISO Code.

30. The same approach for Currency Name.


31.. On the File menu, click Save All.

Now let's define the cube.


32. In Solution Explorer, right-click Cubes, and then click New Cube.

33. On the Welcome to the Cube Wizard page, click Next.

34. On the Select Creation Method page, verify that the Use existing tables option is selected, and then click Next.

35. On the Select Measure Group Tables page, verify that the dsvCurrency data source view is selected.

36. Click Suggest to have the cube wizard suggest tables to use to create measure groups.


37. Click Next.

38. On the Select Measures page, review the selected measures in the Currency Rate and the Fact Order Line measure group.


39. Click Next.

40. On the Select Existing Dimensions page click Next.

41. Click Next.

42. On the Completing the Wizard page, change the name of the cube to MultiCurrency.

43. Click Finish to complete the wizard.

44. On the File menu, click Save All.

Before using the Business Intelligence wizard we have to make some adjustments in the model:

45. Change the IsAggregatable property to False for the key attribute.

46. Change the Type property of the measure group "Exchange Rate"  to ExchangeRate (Best practice).

Now it's time to start the Business Intelligence Wizard :

47. Right click on the cube in the Solution Explorer and Click on " Add Business Intelligence".

48. Click Next.

49, Click on "Define Currency conversion" in the Choose Enhancement window and press Next.

If you did not process the cube earlier the following window appears


Now let's process the cube and see if there are some changes in this window:


Now this looks better...

50. Press Next.

51. Select Amount in the "Select Members" window and press Next.


52.  In the "Select Conversion Type" window it's possible to select the currency conversion. Make sure that Many-to-Many is selected. Press Next.


53. In the "Define Local Currency Reference" Window a link between the local currency and the transaction is selected.


54. In the "Specify Reporting Currencies" Window select All of the Reporting Currencies and press Next.


55. On the Completing the Wizard page, in the Changes pane, you can see the changes that are being made by the Business Intelligence wizard to the Datasource view, dimensions and the Cube. Press Finish.


The dimension Usage Tab looks like:


A table in the Datasource View is added:


And on the Calculations Tab a MDX Script is added (snippet):


56. In the File Menu,  Click Save All.

57. Deploy and process the Cube.

Now we are done making changes to the cube. Now it's time to check whether the adjustments are doing the right calculations.

58. Start Excel and create a new excel sheet. For this blogpost I used Excel 2013.

59. Go to the Data Tab and select "From Other sources", Select "From Analysis Services"

60. Enter . in the Servername in the Connect to Database Server window.

61. Make Sure that the database "MultiCurrency" and the Cube "MultiCurrency" is selected and press Next.

62. Press Next.

63. Press OK.

If everything went ok a pivot table is created in excel.

64. Now let's select the Amount in the PivotTable fields and put them in the Measures pane, Select currency ID of the Dimcurrency dimension and put that in the Rows Pane and Select the Currency ID of the Reporting Currency and put that in the Columns Pane.

The window now looks like this:


On the left you can see the initially entered currencies and in the columns are the converted amounts to the reporting Currencies shown. Now we have to check whether these are correct values.

For example, lets take the 100 USD. There is one order with a value of 100 dollar on September 23, 2014 and the currency conversion rate on September 23, 2014 is 0.62. So the 100 * 0.62 = 62 dollar. And that is correct.

If we drag the DateID (I know) into the Rows Pane the following values are shown:


Let's double check whether one these values are correct.

Suppose we take the orderlines of September 22, 2014 and compare these with the cube..There are three Orderlines:
  • Two bikes for 5 and 7.7 euro (hmmm bit cheap)
  • One Car for 8.95 Britisch Pounds


The Currency rates on that day are:


I checked the calculations manually in Excel and the calculations are correct.


Conclusion

In this blogpost I've shown the conversion of currencies at query time in the Cube. Now, although this is great, there are some drawbacks about this solution. The CurrencyRate and the DimCurrency are not built according to the Kimball starschema theory. For instance, the key of the dimCurrency dimension is not integer but varchar. So, although it looks great, I'll investigate whether if things could be improved.

According to the blog of Chris Web this solution is not a very performant solution, unfortunately. The solution above takes about 9 seconds on the AdventureWorks Database.

Other references:

Greetz,
Hennie


zondag 31 augustus 2014

70-467 Study Guide reformatted

Introduction

In this blogpost I've gathered and reformatted the study guide of the Microsoft exam 70-467 for SQL Server 2014. This exam is the last (depending on the sequence you take the exams, off course) of the MCSE BI certification. I decided to reformat the guide for a better overview of the topics covered for the exam. Hope that it helps studying the exam topics.

1. Plan business intelligence (BI) infrastructure (15-20%)

  • Plan for performance
    • Optimize batch procedures: extract, transform, load (ETL) in SQL Server Integration Services (SSIS)/SQL and processing phase in Analysis Services.
    • Configure Proactive Caching within SQL Server Analysis Services (SSAS) for different scenarios
    • Analyze and optimize performances of Multidimensional Expression (MDX) and Data Analysis Expression (DAX) queries
    • Understand the difference between partitioning for load performance versus query performance in SSAS.
    • Appropriately index a fact table
    • Optimize Analysis Services cubes in SQL Server Data Tools.
    • Create aggregations.
    • Understand performance consequences of named queries in a data source view.
  • Plan for scalability
    • Multidimensional OLAP (MOLAP).
    • Relational OLAP (ROLAP).
    • Hybrid OLAP (HOLAP).
    • Change binding options for partitions.
  • Plan and manage upgrades
    •  Plan change management for a BI solution.
  • Maintain server health
    • Design an automation strategy. 


2. Design BI infrastructure (15-20%)

  • Design a security strategy
    • Configure security and impersonation between database, analysis services and frontend.
    • Implement Dynamic Dimension Security within a cube.
    • Configure security for an extranet environment.
    • Configure Kerberos security.
    • Skills in authentication mechanisms.
    • Ability to build secure solutions end to end.
    • Design security roles for calculated measures.
    • Understand the tradeoffs between regular SSAS security and dynamic security
  • Design a SQL partitioning strategy
    • Choose the proper partitioning strategy for the data warehouse and cube.
    • Implement a parallel load to fact tables by using partition switching.
    • Use data compression in fact table.
    • Design optimal data compression.
  • Design a High Availability and Disaster Recovery strategy
    • Design a recovery strategy; back up and restore SSAS databases.
    • Back up and restore SSRS databases; move and restore the SSIS Catalog.
    • Design an AlwaysON solution.
  • Design a logging and auditing strategy
    • Design a new SSIS logging infrastructure (for  example, information available through the catalog views).
    • Validate data is balancing and reconciling correctly.


3. Design a reporting solution (20-25%)

  • Design a Reporting Services dataset
    • Data query parameters
    • Managing data rights and security.
    • Extracting data from analysis services.
    • Balancing querybased processing versus filter-based processing.
    • Managing data sets through the use of stored procedure.
    • Create appropriate DAX queries for an application.
    • Extract data from analysis services by using MDX queries
  • Manage Excel Services/reporting for SharePoint
    • Configure data refresh schedules for PowerPivot published to SharePoint.
    • Publish BI info to SharePoint.
    • Use SharePoint to accomplish BI administrative tasks.
    • Install and configure Power View.
    • Publish PowerPivot and Power View to SharePoint.
  • Design a data acquisition strategy
    • Identify the data sources that need to be used to pull in the data.
    • Determine the changes (incremental data) in the data source (time window).
    • Identify the relationship and dependencies between the data sources.
    • Determine who can access which data.
    • What data can be retained for how long (regulatory compliance, data archiving, aging).
    • Design a data movement strategy .
    • Profile source data.
    • Customize data acquisition using DAX with reporting services data sources.
  • Plan and manage reporting services configuration
    • Native mode.
    • Choose the appropriate reporting services requirements (including native mode and SharePoint mode).
  • Design BI reporting solution architecture
    • Linked reports, drill-down reports, drill-through reports, migration strategies, access report services API, sub reports, code-behind strategies.
    • Identify when to use Reporting Services, ReportBuilder, or Crescent.
    • design/implement context transfer when interlinking all types of reports (RS, RB, Crescent, Excel, PowerPivot).
    • Implement BI tools for reporting in SharePoint Excel Services versus Performance Point versus Reporting Services).
    • Select a subscription strategy.
    • Identify when to use Reporting Services, Report Builder, or Power View.
    • Design/implement context transfer when interlinking all types of reports (RS, RB, Power view, Excel).
    • Implement BI tools for reporting in SharePoint (Excel Services versus Power View versus Reporting
    • Services).
    • Enable Data Alerts.
    • Design map visualization.


4. Design BI data models (30-35%)

  • Design the data warehouse
    • Design a data model that is optimized for reporting; design and build a cube on top.
    • Design enterprise data warehouse (EDW) and OLAP cubes; choose between natural keys and surrogate keys when designing the data warehouse; use the facilities available in SQL Server to design, implement and maintain a data warehouse (partitioning, slowly changing dimensions (SCD), change data capture (CDC), Clustered Index Views, etc.).
    • Identify design best practices.
    • Implement a many to many relationship in an OLAP cube.
    • Design a data mart/warehouse in reverse from an Analysis Services cube (or empty Analysis Services cube that was created referring requirements).
    • Choose between performing aggregation operations in the SSIS pipeline or the relational engine.
    • Use SQL Server to design, implement, and maintain a data warehouse (including partitioning, slowly.
    • Changing dimensions [SCD], change data capture  [CDC], Index Views, and columnstore indexes).
    • Design a data mart/warehouse in reverse from an Analysis Services cube.
  • Design a schema
    • Multidimensional modeling starting from a star or snowflake schema.
    • Relational modeling for a Data Mart.
  • Design cube architecture
    • Partition cubes and build aggregation strategies for the separate partitions.
    • Design a data model.
    • Choose the proper partitioning strategy for the data warehouse and cube.
    • Design the data file layout.
    • Given a requirement, identify the aggregation method that should be selected for a measure in a MOLAP cube.
    • Performance tune a MOLAP cube using aggregations.
    • Design a data source view.
    • Cube drill-through and write back actions.
    • Choose the correct grain of data to store in a measure group.
    • Design analysis services processing by using indexes, indexed views, and order by statements.
  • Design fact tables
    • Design a data warehouse that supports many to many dimensions with factless fact tables.
  • Design BI semantic models Revised task – new full definition:
    • Plan for a multidimensional cube.
    • Write a UDM model with many to many (this is related to MDX/BISM code, but it is a good example for exercises).
    • Choose between UDM and BISM depending on the type of data and workload.
    • Plan for a multidimensional cube.
    • Support a many to-many relationship between tables.
    • Choose between multidimensional and tabular depending on the type of data and workload.
  • Design and create MDX calculations
    • MDX authoring.
    • Identify the structures of MDX and the common functions (tuples, sets, topcount, SCOPE etc.) .
    • Identify which MDX statement would return the required result (single result and multiple MDX options provided to test taker).
    • Implement a custom MDX or logical solution for a pre-prepared case task.
    • Create calculated members in an MDX statement.


5. Design an ETL solution (10-15%)

  • Design SSIS package execution
    • Using new project deployment model.
    • Passing values at execution time.
    • share parameters between packages.
    • Plan for incremental loads vs. full loads.
    • Optimize execution by using Balanced Data Distributor (BDD).
    • Choose optimal processing strategy (including Script transform, flat file incremental loads, and Derived Column transform).
  • Plan to deploy SSIS solutions
    • Deploy the package to another server with different security requirements.
    • Secure integration services packages that are deployed at the file system.
    • Demonstrate awareness of SSIS packages/projects  and how they interact with environments (including recoverability).
    • Decide between performing aggregation operations in the SSIS pipeline or the relational engine
    • Plan to automate SSIS deployment.
    • Plan the administration of the SSIS Catalog database.
  • Design package configurations for SSIS packages
    • Avoid repeating configuration information entered in SSIS packages and use configuration file.

Conclusion

This blogpost is about reformatting of the study guide for the 70-467 exam.


Greetz,

Hennie

woensdag 16 juli 2014

SSAS : Introduction to Tabular Model in SQL Server 2014 (RTM) (Part I)

Introduction

In this introduction blogpost I'll explain the Tabular Model with a walk through the tutorial that is available on MSDN. In this tutorial a Tabular Model is created on the AdventureWorks Database. This tutorial is based on the Adventure Works Cycles, a fictitious company. They produce and distributes bicycles in North America, europe and Asia.

1. Setting up the project

The first thing to do is creating the project with Visual Studio 2012. In SQL Server Data Tools, on the File menu, click New, and then click Project. In the New Project dialog box, under Installed Templates, click Business Intelligence, then click Analysis Services, and then click Analysis Services Tabular Project. In Name, type AW Internet Sales Tabular Model, then specify a location for the project files. Click OK.


2. Select an Analysis Services Instance

The next dialog is about selecting the right Workspace Server and the right compatibility level. First set the Workspace server to the Tabular Model Instance in SQL Server. The next thing to do is setting the compatibility level of Tabular model. In SQL Server 2014 Analysis Services Instance supports the following compatibility levels (database version) (MSDN):
  • SQL Server 2012 (1100)
  • SQL Server 2012 SP1 (1103)
  • SQL Server 2014 (1103)
Strangly enough, I see two compatability levels: SQL Server 2012 (1100) and SQL Server 2012 SP1 (1103).

I assume that SQL Server SQL Server 2012 SP1 (1103) and SQL Server 2014 (1103) are the same. Checking the compatibilty level in the Analysis Service Properties in SQL Server Managament Studio shows me that the compatibility level is also 1103.


Kasper de Jonge blogged about the differences between compatability levels 1100 and 1103. Please take a look at the differences between the two.

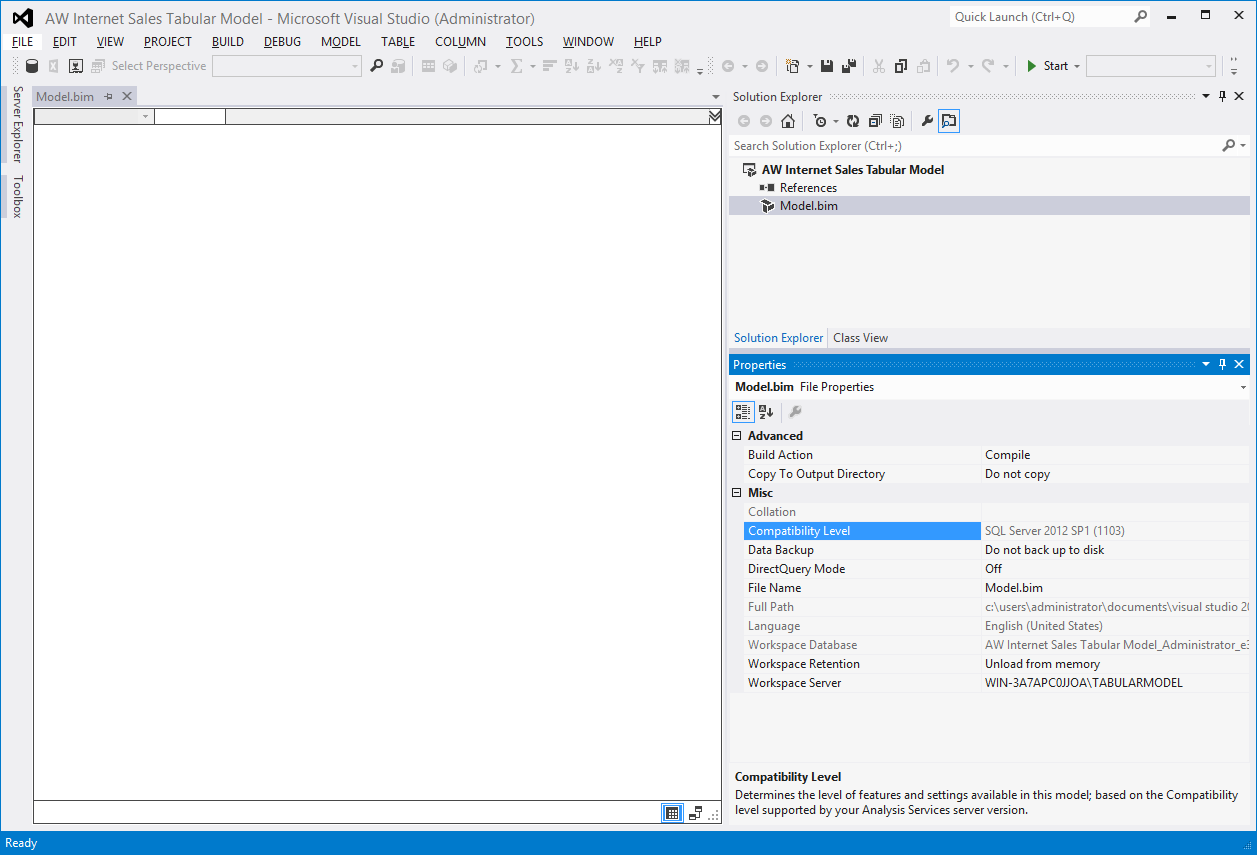
3. The Tabular project

Once you have created the Tabular project the following window is presented on the screen. There are a couple of interesting menus, options and properties available. In the Model menu, you can launch the Table Import Wizard, view and edit existing connections, refresh workspace data, browse your model in Microsoft Excel with the Analyze in Excel feature, create perspectives and roles, select the model view, and set calculation options. In the Table menu, you can create and manage relationships between tables, create and manage, specify date table settings, create partitions, and edit table properties. And in the Column menu you can add and delete columns in a table, freeze columns, and specify sort order. 


In the properties window of the model.bim, you can also see the compatbility level again(1103), the DirectQuery property. This property handles the In Memory (or not) possibillity of deploying a Tabular model.

Conclusion

In this blogpost I described an introduction to the Tabular model (Part I). I wrote about the compatability level of Tabular Model in SQL Server 2014 and Visual Studio 2012.

Greetz,
Hennie

donderdag 10 juli 2014

R: getwd() and setwd() (Part II)

Introduction

R is a very popular programming language for statistical analysis of data. All kind of tools are supporting R or they will. In this blogpost and followup blogpost I've gathered some constructs in R that are quite often used when you program in R. This is not a complete list but it is a handy list.

This is the second post about R in a series:
  • R : An introduction (Part I).
  • R : getwd() and setwd()  (Part II).

getwd() and setwd()

The first step using R is checking out the working directory. The working directory is the place where all of your project files are placed.You need to keep track in each of your R session.If you read or write files, this takes place in the working directory.


> getwd()
[1] "C:/Users/Hennie/Documents"

Setting the working directory is executed with setwd()

> setwd("~/Coursera-RProgramming")
> getwd()
[1] "C:/Users/Hennie/Documents/Coursera-RProgramming" 

Conclusion

With setwd() and getwd() the workingdirectory is set and checked.

Greetz,
Hennie