Introduction
Loading a dataplatform can be sometimes difficult and gaining control of the loading process can help to understand which tables are loading and which not. And, you can view in one oversight the numbers of records that are loaded and you can compare each of them.
In this blogpost I've created a sample query, but that is fixed and it has to be maintained in order to keep up with developments (new or removed tables). Therefore, I've created a script that automatically calculate the number of records, per load date for every table in a database that has a load_date in the table.
The goal
Beneath here, I've included an example query that is the goal of this blogpost. The goal is to generate this query in an automated way with dynamic SQL.
SELECT
'A' AS TABLE_NAME,
LOAD_DATE,
Count(*) AS COUNT
FROM A
GROUP BY LOAD_DATE
UNION ALL
SELECT
'B' AS TABLE_NAME,
LOAD_DATE,
Count(*) AS COUNT
FROM B
GROUP BY LOAD_DATE
UNION ALL
SELECT
'C' AS TABLE_NAME,
LOAD_DATE,
Count(*) AS COUNT
FROM C
GROUP BY LOAD_DATE
Set up a small demo DB
CREATE OR REPLACE DATABASE COUNTDB;

CREATE TABLE A(A STRING, LOAD_DATE TIMESTAMP_NTZ);
INSERT INTO A VALUES ('A', '2023-11-01'),('AA', '2023-11-01'),('AAA', '2023-11-02');
SELECT * FROM A;

CREATE TABLE B(B STRING, LOAD_DATE TIMESTAMP_NTZ);
INSERT INTO B VALUES ('B', '2023-11-01'),('BB', '2023-11-03');

CREATE TABLE C(C STRING, LOAD_DATE TIMESTAMP_NTZ);
INSERT INTO C VALUES ('C', '2023-11-01'),('CC', '2023-11-04');
Dynamic SQL
Now the next step is to create a string (QUERY) that is concatenated with a piece of a query for every table.:
SELECT
'A' AS TABLE_NAME,
LOAD_DATE,
Count(*) AS COUNT
FROM A
GROUP BY LOAD_DATE
UNION ALL
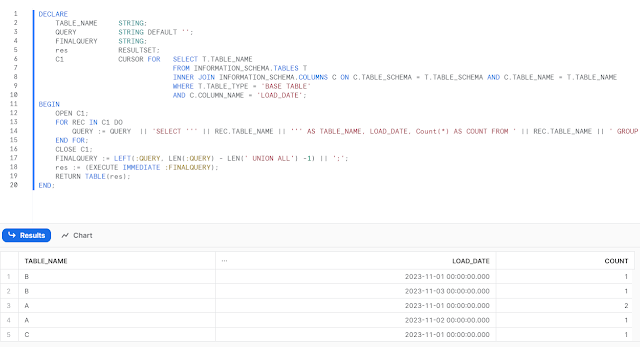
I've created a cursor that is used in a FOR loop for every table in the database. With this information it will setup a dynamic SQL Query. In a FINALQUERY variable, the last UNION ALL is removed and I added an ORDER BY LOAD_DATE DESC, but it doesn't seem to work in the dashboard of Snowflake. The Dashboard sorts the Loaddates in a ascending way (and I wanted in an descending manner).
DECLARE
    TABLE_NAME     STRING;
    QUERY          STRING DEFAULT '';
    FINALQUERY     STRING;
    res            RESULTSET;
    C1             CURSOR FOR   SELECT T.TABLE_NAME, T.TABLE_SCHEMA
                                FROM INFORMATION_SCHEMA.TABLES T
                                INNER JOIN INFORMATION_SCHEMA.COLUMNS C ON C.TABLE_SCHEMA = T.TABLE_SCHEMA AND C.TABLE_NAME = T.TABLE_NAME
                                WHERE T.TABLE_TYPE = 'BASE TABLE'
                                AND C.COLUMN_NAME = 'LOAD_DATE';
BEGIN
    OPEN C1;
    FOR REC IN C1 DO
        QUERY := QUERY  || 'SELECT ''' || REC.TABLE_NAME || ''' AS TABLE_NAME, LOAD_DATE, Count(*) AS COUNT FROM ' || REC.TABLE_SCHEMA || '.' || REC.TABLE_NAME || ' GROUP BY LOAD_DATE UNION ALL ';
    END FOR;
    CLOSE C1;
    FINALQUERY :=  LEFT(:QUERY, LEN(:QUERY) - LEN(' UNION ALL') -1) || ' ORDER BY LOAD_DATE DESC;';
    res := (EXECUTE IMMEDIATE :FINALQUERY);
    RETURN TABLE(res);

END;
Creating a Dashboard

Click on New Tile.

And then insert the query that I've included in this blogpost.

Geen opmerkingen:
Een reactie posten